Yaqui vs Immigrants from Jamaica 5th Grade
COMPARE
Yaqui
Immigrants from Jamaica
5th Grade
5th Grade Comparison
Yaqui
Immigrants from Jamaica
96.7%
5TH GRADE
0.1/ 100
METRIC RATING
273rd/ 347
METRIC RANK
96.8%
5TH GRADE
0.4/ 100
METRIC RATING
260th/ 347
METRIC RANK
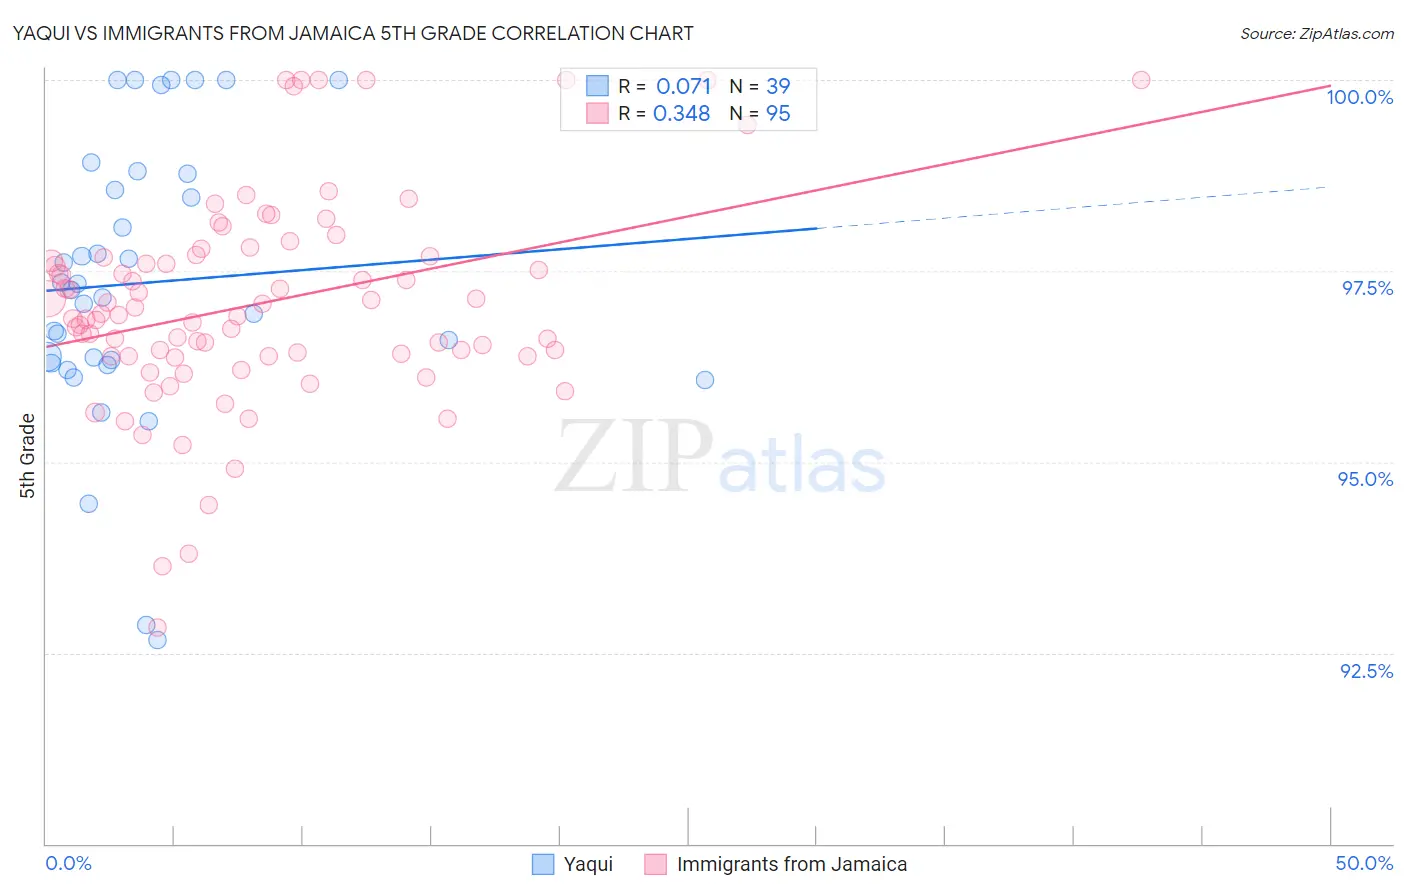
Yaqui vs Immigrants from Jamaica 5th Grade Correlation Chart
The statistical analysis conducted on geographies consisting of 107,725,021 people shows a slight positive correlation between the proportion of Yaqui and percentage of population with at least 5th grade education in the United States with a correlation coefficient (R) of 0.071 and weighted average of 96.7%. Similarly, the statistical analysis conducted on geographies consisting of 301,829,538 people shows a mild positive correlation between the proportion of Immigrants from Jamaica and percentage of population with at least 5th grade education in the United States with a correlation coefficient (R) of 0.348 and weighted average of 96.8%, a difference of 0.12%.
5th Grade Correlation Summary
| Measurement | Yaqui | Immigrants from Jamaica |
| Minimum | 92.7% | 92.8% |
| Maximum | 100.0% | 100.0% |
| Range | 7.3% | 7.2% |
| Mean | 97.3% | 97.1% |
| Median | 97.2% | 96.9% |
| Interquartile 25% (IQ1) | 96.3% | 96.4% |
| Interquartile 75% (IQ3) | 98.8% | 97.7% |
| Interquartile Range (IQR) | 2.5% | 1.3% |
| Standard Deviation (Sample) | 1.8% | 1.4% |
| Standard Deviation (Population) | 1.8% | 1.4% |
Demographics Similar to Yaqui and Immigrants from Jamaica by 5th Grade
In terms of 5th grade, the demographic groups most similar to Yaqui are Immigrants from Cameroon (96.7%, a difference of 0.0%), Trinidadian and Tobagonian (96.7%, a difference of 0.010%), Immigrants from Peru (96.6%, a difference of 0.010%), Cuban (96.6%, a difference of 0.010%), and Afghan (96.7%, a difference of 0.020%). Similarly, the demographic groups most similar to Immigrants from Jamaica are Immigrants from Sierra Leone (96.8%, a difference of 0.0%), Immigrants from Colombia (96.8%, a difference of 0.0%), Immigrants from Uzbekistan (96.8%, a difference of 0.010%), Immigrants from Ethiopia (96.8%, a difference of 0.020%), and Immigrants from China (96.8%, a difference of 0.020%).
| Demographics | Rating | Rank | 5th Grade |
| Immigrants | Congo | 0.7 /100 | #256 | Tragic 96.8% |
| Peruvians | 0.6 /100 | #257 | Tragic 96.8% |
| Immigrants | Ethiopia | 0.5 /100 | #258 | Tragic 96.8% |
| Immigrants | China | 0.5 /100 | #259 | Tragic 96.8% |
| Immigrants | Jamaica | 0.4 /100 | #260 | Tragic 96.8% |
| Immigrants | Sierra Leone | 0.4 /100 | #261 | Tragic 96.8% |
| Immigrants | Colombia | 0.4 /100 | #262 | Tragic 96.8% |
| Immigrants | Uzbekistan | 0.3 /100 | #263 | Tragic 96.8% |
| West Indians | 0.3 /100 | #264 | Tragic 96.8% |
| Taiwanese | 0.3 /100 | #265 | Tragic 96.7% |
| Immigrants | Nigeria | 0.3 /100 | #266 | Tragic 96.7% |
| Immigrants | South America | 0.3 /100 | #267 | Tragic 96.7% |
| Armenians | 0.3 /100 | #268 | Tragic 96.7% |
| Ghanaians | 0.2 /100 | #269 | Tragic 96.7% |
| Afghans | 0.2 /100 | #270 | Tragic 96.7% |
| Immigrants | Hong Kong | 0.2 /100 | #271 | Tragic 96.7% |
| Trinidadians and Tobagonians | 0.1 /100 | #272 | Tragic 96.7% |
| Yaqui | 0.1 /100 | #273 | Tragic 96.7% |
| Immigrants | Cameroon | 0.1 /100 | #274 | Tragic 96.7% |
| Immigrants | Peru | 0.1 /100 | #275 | Tragic 96.6% |
| Cubans | 0.1 /100 | #276 | Tragic 96.6% |