Samoan vs Immigrants from Haiti 3rd Grade
COMPARE
Samoan
Immigrants from Haiti
3rd Grade
3rd Grade Comparison
Samoans
Immigrants from Haiti
97.5%
3RD GRADE
6.9/ 100
METRIC RATING
216th/ 347
METRIC RANK
96.7%
3RD GRADE
0.0/ 100
METRIC RATING
308th/ 347
METRIC RANK
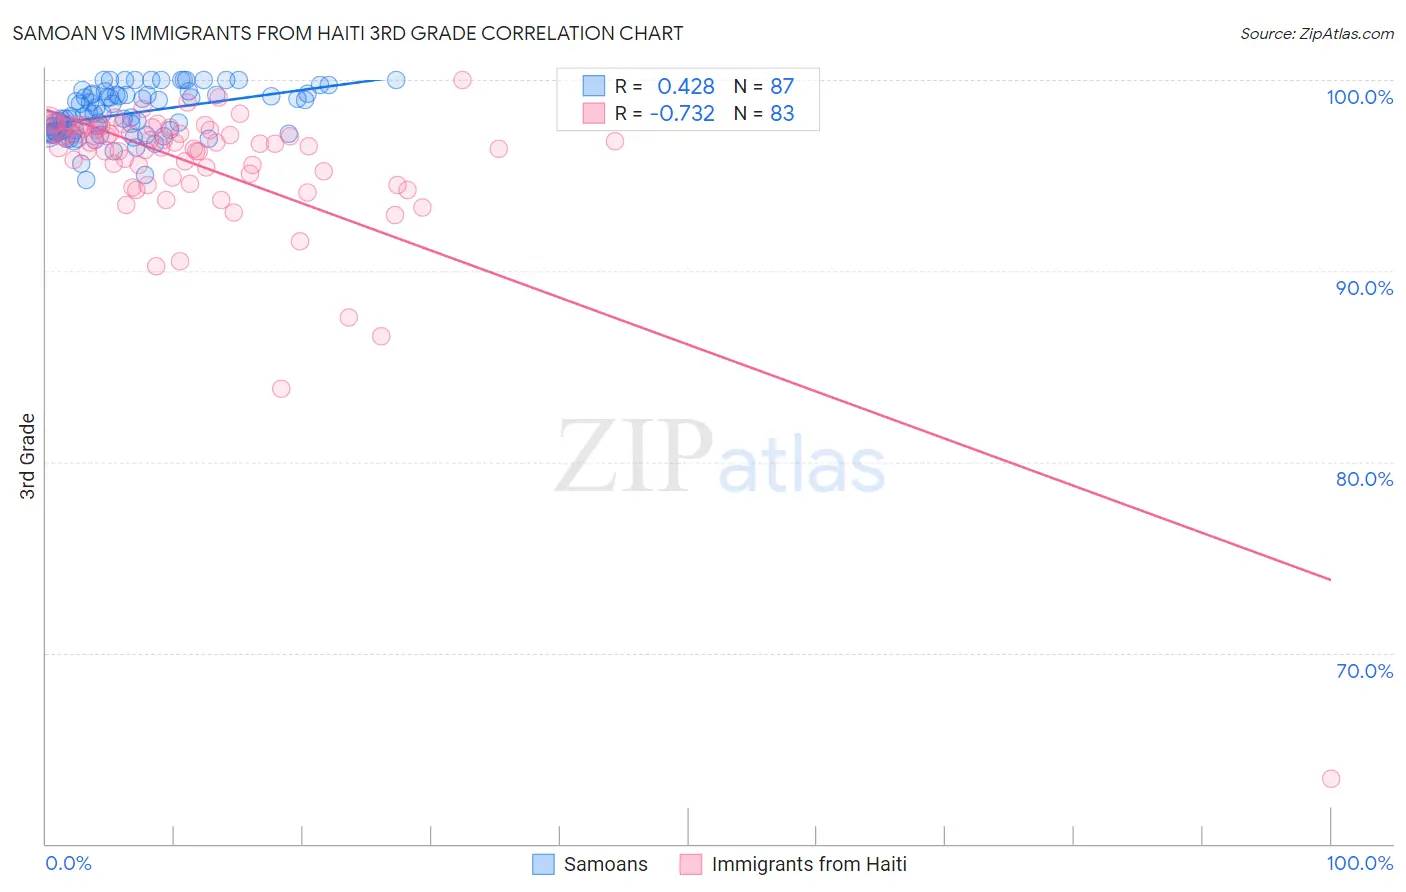
Samoan vs Immigrants from Haiti 3rd Grade Correlation Chart
The statistical analysis conducted on geographies consisting of 225,201,431 people shows a moderate positive correlation between the proportion of Samoans and percentage of population with at least 3rd grade education in the United States with a correlation coefficient (R) of 0.428 and weighted average of 97.5%. Similarly, the statistical analysis conducted on geographies consisting of 225,286,718 people shows a strong negative correlation between the proportion of Immigrants from Haiti and percentage of population with at least 3rd grade education in the United States with a correlation coefficient (R) of -0.732 and weighted average of 96.7%, a difference of 0.90%.
3rd Grade Correlation Summary
| Measurement | Samoan | Immigrants from Haiti |
| Minimum | 94.7% | 63.4% |
| Maximum | 100.0% | 100.0% |
| Range | 5.3% | 36.6% |
| Mean | 98.3% | 95.5% |
| Median | 98.1% | 96.6% |
| Interquartile 25% (IQ1) | 97.3% | 94.9% |
| Interquartile 75% (IQ3) | 99.2% | 97.5% |
| Interquartile Range (IQR) | 2.0% | 2.6% |
| Standard Deviation (Sample) | 1.2% | 4.4% |
| Standard Deviation (Population) | 1.2% | 4.4% |
Similar Demographics by 3rd Grade
Demographics Similar to Samoans by 3rd Grade
In terms of 3rd grade, the demographic groups most similar to Samoans are Iraqi (97.5%, a difference of 0.0%), Immigrants from Bahamas (97.6%, a difference of 0.020%), Moroccan (97.6%, a difference of 0.020%), Yuman (97.6%, a difference of 0.020%), and South American Indian (97.5%, a difference of 0.020%).
| Demographics | Rating | Rank | 3rd Grade |
| Costa Ricans | 9.6 /100 | #209 | Tragic 97.6% |
| Immigrants | Oceania | 9.5 /100 | #210 | Tragic 97.6% |
| Laotians | 9.4 /100 | #211 | Tragic 97.6% |
| Immigrants | Bahamas | 8.5 /100 | #212 | Tragic 97.6% |
| Moroccans | 8.5 /100 | #213 | Tragic 97.6% |
| Yuman | 8.4 /100 | #214 | Tragic 97.6% |
| Iraqis | 6.9 /100 | #215 | Tragic 97.5% |
| Samoans | 6.9 /100 | #216 | Tragic 97.5% |
| South American Indians | 5.7 /100 | #217 | Tragic 97.5% |
| Immigrants | Nepal | 5.3 /100 | #218 | Tragic 97.5% |
| Immigrants | Panama | 5.2 /100 | #219 | Tragic 97.5% |
| Immigrants | Morocco | 5.0 /100 | #220 | Tragic 97.5% |
| Uruguayans | 5.0 /100 | #221 | Tragic 97.5% |
| Sierra Leoneans | 4.6 /100 | #222 | Tragic 97.5% |
| Immigrants | Syria | 4.4 /100 | #223 | Tragic 97.5% |
Demographics Similar to Immigrants from Haiti by 3rd Grade
In terms of 3rd grade, the demographic groups most similar to Immigrants from Haiti are Nicaraguan (96.7%, a difference of 0.0%), Sri Lankan (96.7%, a difference of 0.0%), Guyanese (96.7%, a difference of 0.020%), Cape Verdean (96.6%, a difference of 0.030%), and Central American Indian (96.7%, a difference of 0.050%).
| Demographics | Rating | Rank | 3rd Grade |
| Immigrants | Cuba | 0.0 /100 | #301 | Tragic 96.8% |
| Immigrants | Somalia | 0.0 /100 | #302 | Tragic 96.8% |
| Ecuadorians | 0.0 /100 | #303 | Tragic 96.7% |
| Immigrants | Caribbean | 0.0 /100 | #304 | Tragic 96.7% |
| Central American Indians | 0.0 /100 | #305 | Tragic 96.7% |
| Guyanese | 0.0 /100 | #306 | Tragic 96.7% |
| Nicaraguans | 0.0 /100 | #307 | Tragic 96.7% |
| Immigrants | Haiti | 0.0 /100 | #308 | Tragic 96.7% |
| Sri Lankans | 0.0 /100 | #309 | Tragic 96.7% |
| Cape Verdeans | 0.0 /100 | #310 | Tragic 96.6% |
| Immigrants | Guyana | 0.0 /100 | #311 | Tragic 96.6% |
| Immigrants | Laos | 0.0 /100 | #312 | Tragic 96.6% |
| Immigrants | Ecuador | 0.0 /100 | #313 | Tragic 96.6% |
| Belizeans | 0.0 /100 | #314 | Tragic 96.6% |
| Immigrants | Azores | 0.0 /100 | #315 | Tragic 96.6% |