West Indian vs Japanese 5th Grade
COMPARE
West Indian
Japanese
5th Grade
5th Grade Comparison
West Indians
Japanese
96.8%
5TH GRADE
0.3/ 100
METRIC RATING
264th/ 347
METRIC RANK
95.7%
5TH GRADE
0.0/ 100
METRIC RATING
319th/ 347
METRIC RANK
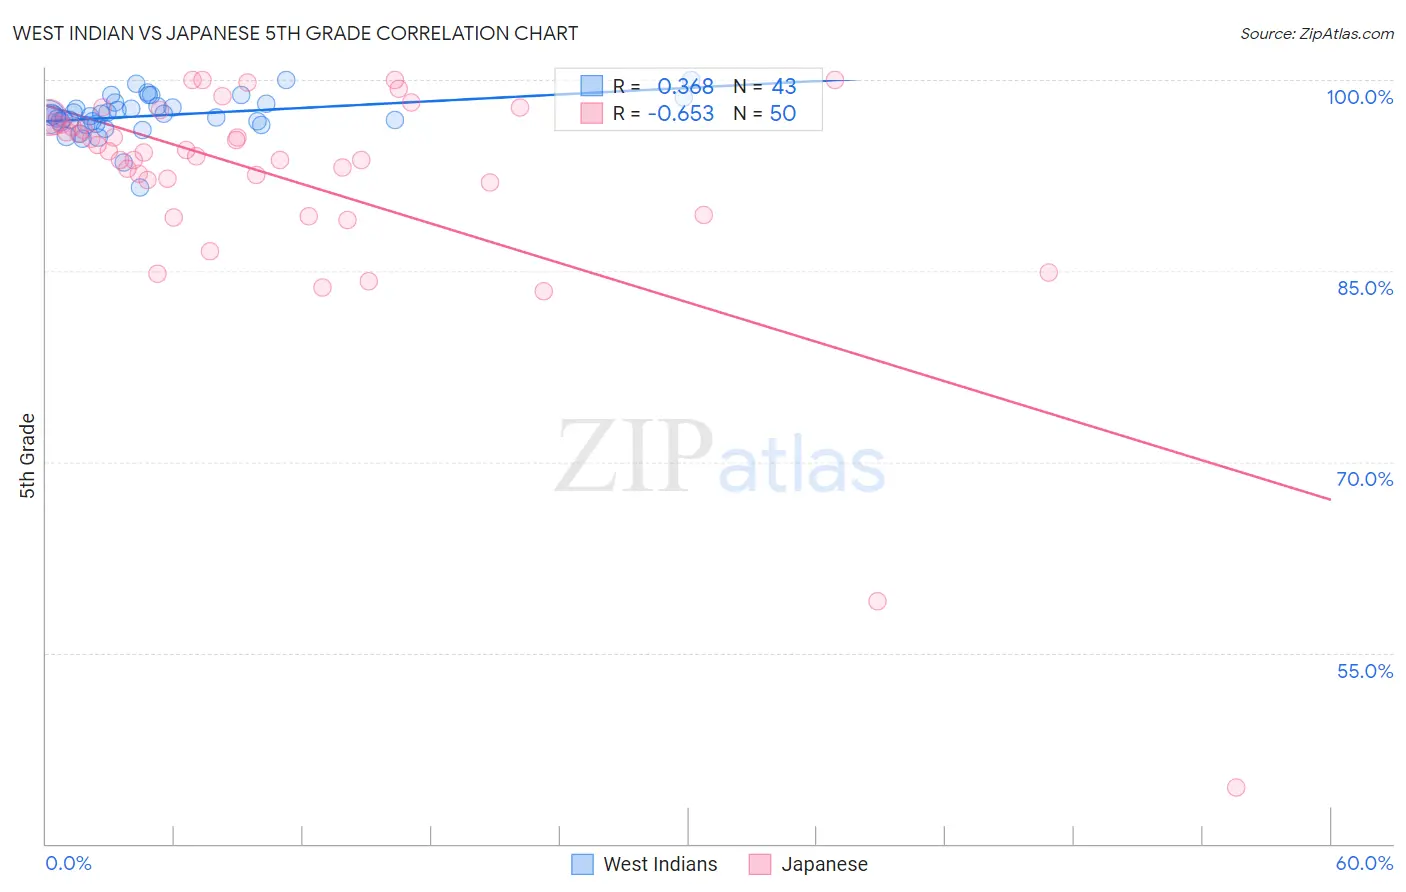
West Indian vs Japanese 5th Grade Correlation Chart
The statistical analysis conducted on geographies consisting of 254,059,006 people shows a mild positive correlation between the proportion of West Indians and percentage of population with at least 5th grade education in the United States with a correlation coefficient (R) of 0.368 and weighted average of 96.8%. Similarly, the statistical analysis conducted on geographies consisting of 249,183,224 people shows a significant negative correlation between the proportion of Japanese and percentage of population with at least 5th grade education in the United States with a correlation coefficient (R) of -0.653 and weighted average of 95.7%, a difference of 1.1%.
5th Grade Correlation Summary
| Measurement | West Indian | Japanese |
| Minimum | 91.6% | 44.4% |
| Maximum | 100.0% | 100.0% |
| Range | 8.4% | 55.6% |
| Mean | 97.2% | 92.2% |
| Median | 97.2% | 94.4% |
| Interquartile 25% (IQ1) | 96.6% | 92.0% |
| Interquartile 75% (IQ3) | 98.2% | 96.5% |
| Interquartile Range (IQR) | 1.6% | 4.5% |
| Standard Deviation (Sample) | 1.6% | 9.6% |
| Standard Deviation (Population) | 1.5% | 9.5% |
Similar Demographics by 5th Grade
Demographics Similar to West Indians by 5th Grade
In terms of 5th grade, the demographic groups most similar to West Indians are Taiwanese (96.7%, a difference of 0.0%), Immigrants from Colombia (96.8%, a difference of 0.010%), Immigrants from Uzbekistan (96.8%, a difference of 0.010%), Immigrants from Nigeria (96.7%, a difference of 0.010%), and Immigrants from South America (96.7%, a difference of 0.010%).
| Demographics | Rating | Rank | 5th Grade |
| Peruvians | 0.6 /100 | #257 | Tragic 96.8% |
| Immigrants | Ethiopia | 0.5 /100 | #258 | Tragic 96.8% |
| Immigrants | China | 0.5 /100 | #259 | Tragic 96.8% |
| Immigrants | Jamaica | 0.4 /100 | #260 | Tragic 96.8% |
| Immigrants | Sierra Leone | 0.4 /100 | #261 | Tragic 96.8% |
| Immigrants | Colombia | 0.4 /100 | #262 | Tragic 96.8% |
| Immigrants | Uzbekistan | 0.3 /100 | #263 | Tragic 96.8% |
| West Indians | 0.3 /100 | #264 | Tragic 96.8% |
| Taiwanese | 0.3 /100 | #265 | Tragic 96.7% |
| Immigrants | Nigeria | 0.3 /100 | #266 | Tragic 96.7% |
| Immigrants | South America | 0.3 /100 | #267 | Tragic 96.7% |
| Armenians | 0.3 /100 | #268 | Tragic 96.7% |
| Ghanaians | 0.2 /100 | #269 | Tragic 96.7% |
| Afghans | 0.2 /100 | #270 | Tragic 96.7% |
| Immigrants | Hong Kong | 0.2 /100 | #271 | Tragic 96.7% |
Demographics Similar to Japanese by 5th Grade
In terms of 5th grade, the demographic groups most similar to Japanese are Central American Indian (95.7%, a difference of 0.0%), Immigrants from Vietnam (95.8%, a difference of 0.050%), Belizean (95.8%, a difference of 0.070%), Immigrants from Belize (95.7%, a difference of 0.080%), and Immigrants from Nicaragua (95.6%, a difference of 0.090%).
| Demographics | Rating | Rank | 5th Grade |
| Vietnamese | 0.0 /100 | #312 | Tragic 95.9% |
| Bangladeshis | 0.0 /100 | #313 | Tragic 95.9% |
| Immigrants | Portugal | 0.0 /100 | #314 | Tragic 95.9% |
| Nicaraguans | 0.0 /100 | #315 | Tragic 95.9% |
| Immigrants | Ecuador | 0.0 /100 | #316 | Tragic 95.8% |
| Belizeans | 0.0 /100 | #317 | Tragic 95.8% |
| Immigrants | Vietnam | 0.0 /100 | #318 | Tragic 95.8% |
| Japanese | 0.0 /100 | #319 | Tragic 95.7% |
| Central American Indians | 0.0 /100 | #320 | Tragic 95.7% |
| Immigrants | Belize | 0.0 /100 | #321 | Tragic 95.7% |
| Immigrants | Nicaragua | 0.0 /100 | #322 | Tragic 95.6% |
| Immigrants | Fiji | 0.0 /100 | #323 | Tragic 95.6% |
| Hondurans | 0.0 /100 | #324 | Tragic 95.6% |
| Hispanics or Latinos | 0.0 /100 | #325 | Tragic 95.6% |
| Immigrants | Cambodia | 0.0 /100 | #326 | Tragic 95.5% |