West Indian vs Immigrants from Asia 5th Grade
COMPARE
West Indian
Immigrants from Asia
5th Grade
5th Grade Comparison
West Indians
Immigrants from Asia
96.8%
5TH GRADE
0.3/ 100
METRIC RATING
264th/ 347
METRIC RANK
96.9%
5TH GRADE
1.7/ 100
METRIC RATING
241st/ 347
METRIC RANK
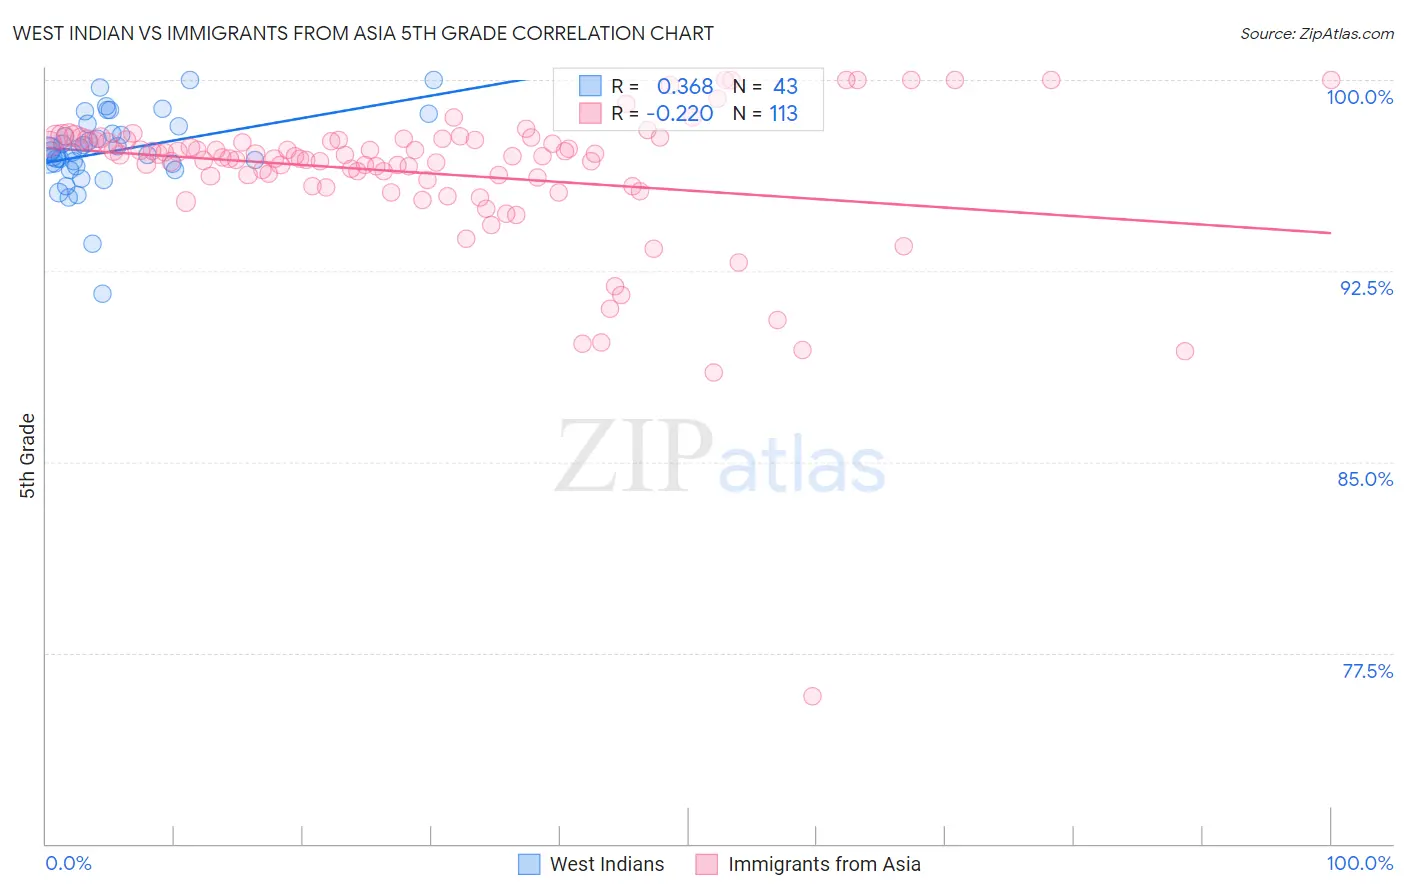
West Indian vs Immigrants from Asia 5th Grade Correlation Chart
The statistical analysis conducted on geographies consisting of 254,059,006 people shows a mild positive correlation between the proportion of West Indians and percentage of population with at least 5th grade education in the United States with a correlation coefficient (R) of 0.368 and weighted average of 96.8%. Similarly, the statistical analysis conducted on geographies consisting of 549,170,438 people shows a weak negative correlation between the proportion of Immigrants from Asia and percentage of population with at least 5th grade education in the United States with a correlation coefficient (R) of -0.220 and weighted average of 96.9%, a difference of 0.17%.
5th Grade Correlation Summary
| Measurement | West Indian | Immigrants from Asia |
| Minimum | 91.6% | 75.8% |
| Maximum | 100.0% | 100.0% |
| Range | 8.4% | 24.2% |
| Mean | 97.2% | 96.3% |
| Median | 97.2% | 97.0% |
| Interquartile 25% (IQ1) | 96.6% | 96.0% |
| Interquartile 75% (IQ3) | 98.2% | 97.6% |
| Interquartile Range (IQR) | 1.6% | 1.7% |
| Standard Deviation (Sample) | 1.6% | 3.0% |
| Standard Deviation (Population) | 1.5% | 3.0% |
Similar Demographics by 5th Grade
Demographics Similar to West Indians by 5th Grade
In terms of 5th grade, the demographic groups most similar to West Indians are Taiwanese (96.7%, a difference of 0.0%), Immigrants from Colombia (96.8%, a difference of 0.010%), Immigrants from Uzbekistan (96.8%, a difference of 0.010%), Immigrants from Nigeria (96.7%, a difference of 0.010%), and Immigrants from South America (96.7%, a difference of 0.010%).
| Demographics | Rating | Rank | 5th Grade |
| Peruvians | 0.6 /100 | #257 | Tragic 96.8% |
| Immigrants | Ethiopia | 0.5 /100 | #258 | Tragic 96.8% |
| Immigrants | China | 0.5 /100 | #259 | Tragic 96.8% |
| Immigrants | Jamaica | 0.4 /100 | #260 | Tragic 96.8% |
| Immigrants | Sierra Leone | 0.4 /100 | #261 | Tragic 96.8% |
| Immigrants | Colombia | 0.4 /100 | #262 | Tragic 96.8% |
| Immigrants | Uzbekistan | 0.3 /100 | #263 | Tragic 96.8% |
| West Indians | 0.3 /100 | #264 | Tragic 96.8% |
| Taiwanese | 0.3 /100 | #265 | Tragic 96.7% |
| Immigrants | Nigeria | 0.3 /100 | #266 | Tragic 96.7% |
| Immigrants | South America | 0.3 /100 | #267 | Tragic 96.7% |
| Armenians | 0.3 /100 | #268 | Tragic 96.7% |
| Ghanaians | 0.2 /100 | #269 | Tragic 96.7% |
| Afghans | 0.2 /100 | #270 | Tragic 96.7% |
| Immigrants | Hong Kong | 0.2 /100 | #271 | Tragic 96.7% |
Demographics Similar to Immigrants from Asia by 5th Grade
In terms of 5th grade, the demographic groups most similar to Immigrants from Asia are Immigrants from Costa Rica (96.9%, a difference of 0.0%), Immigrants from Eastern Africa (96.9%, a difference of 0.0%), Indian (Asian) (96.9%, a difference of 0.010%), Korean (96.9%, a difference of 0.010%), and Immigrants from Indonesia (96.9%, a difference of 0.020%).
| Demographics | Rating | Rank | 5th Grade |
| Tohono O'odham | 3.2 /100 | #234 | Tragic 97.0% |
| Uruguayans | 3.2 /100 | #235 | Tragic 97.0% |
| Senegalese | 2.8 /100 | #236 | Tragic 97.0% |
| Immigrants | Indonesia | 2.0 /100 | #237 | Tragic 96.9% |
| Asians | 2.0 /100 | #238 | Tragic 96.9% |
| Nigerians | 1.9 /100 | #239 | Tragic 96.9% |
| Indians (Asian) | 1.9 /100 | #240 | Tragic 96.9% |
| Immigrants | Asia | 1.7 /100 | #241 | Tragic 96.9% |
| Immigrants | Costa Rica | 1.6 /100 | #242 | Tragic 96.9% |
| Immigrants | Eastern Africa | 1.6 /100 | #243 | Tragic 96.9% |
| Koreans | 1.6 /100 | #244 | Tragic 96.9% |
| Colombians | 1.3 /100 | #245 | Tragic 96.9% |
| Ethiopians | 1.2 /100 | #246 | Tragic 96.9% |
| Immigrants | Africa | 1.1 /100 | #247 | Tragic 96.9% |
| U.S. Virgin Islanders | 1.1 /100 | #248 | Tragic 96.9% |