Soviet Union vs Japanese 5th Grade
COMPARE
Soviet Union
Japanese
5th Grade
5th Grade Comparison
Soviet Union
Japanese
97.5%
5TH GRADE
81.2/ 100
METRIC RATING
147th/ 347
METRIC RANK
95.7%
5TH GRADE
0.0/ 100
METRIC RATING
319th/ 347
METRIC RANK
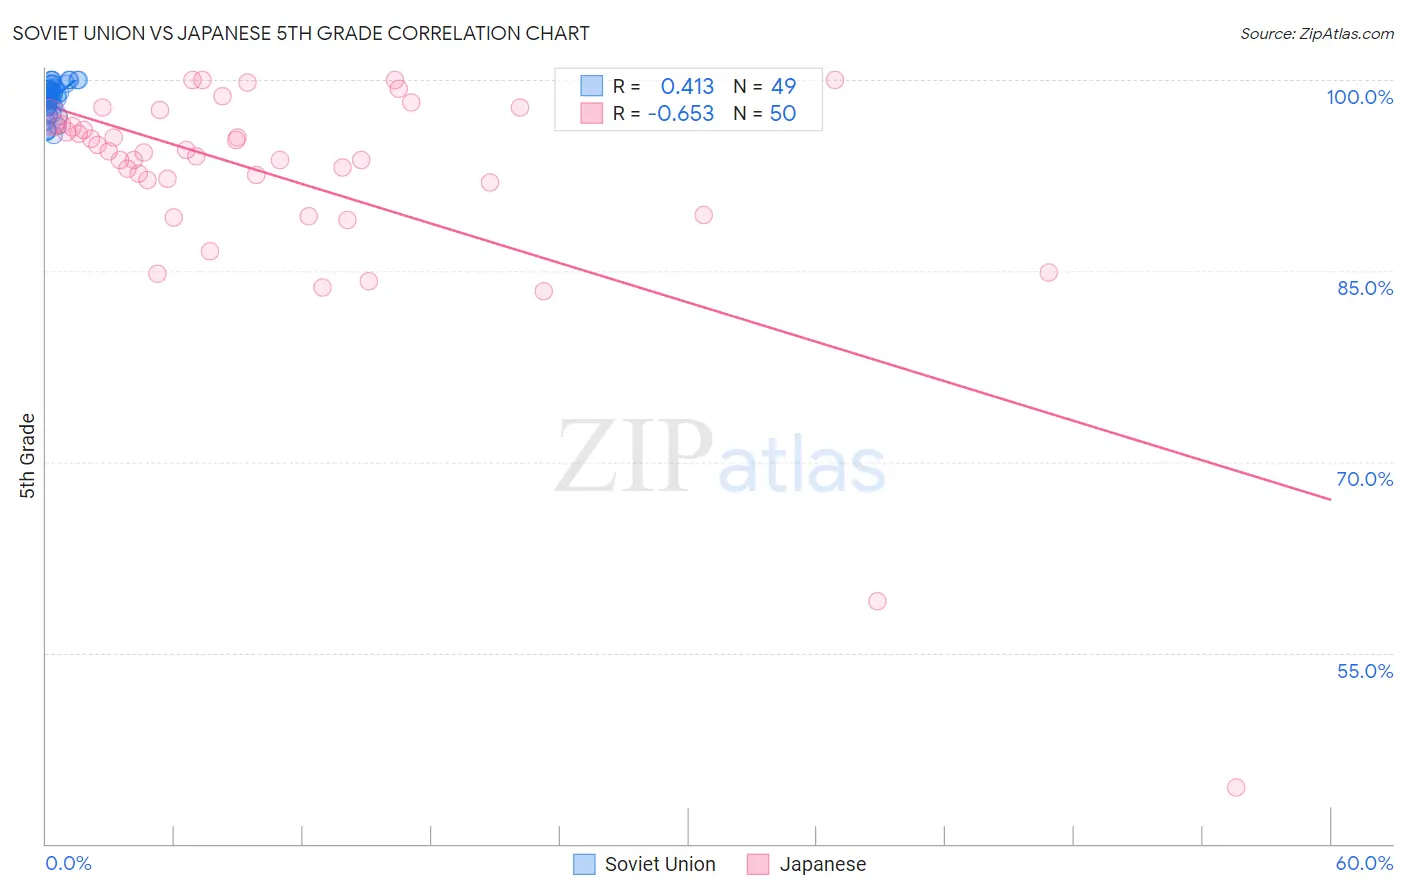
Soviet Union vs Japanese 5th Grade Correlation Chart
The statistical analysis conducted on geographies consisting of 43,454,395 people shows a moderate positive correlation between the proportion of Soviet Union and percentage of population with at least 5th grade education in the United States with a correlation coefficient (R) of 0.413 and weighted average of 97.5%. Similarly, the statistical analysis conducted on geographies consisting of 249,183,224 people shows a significant negative correlation between the proportion of Japanese and percentage of population with at least 5th grade education in the United States with a correlation coefficient (R) of -0.653 and weighted average of 95.7%, a difference of 1.8%.
5th Grade Correlation Summary
| Measurement | Soviet Union | Japanese |
| Minimum | 95.7% | 44.4% |
| Maximum | 100.0% | 100.0% |
| Range | 4.3% | 55.6% |
| Mean | 98.5% | 92.2% |
| Median | 98.8% | 94.4% |
| Interquartile 25% (IQ1) | 97.9% | 92.0% |
| Interquartile 75% (IQ3) | 99.4% | 96.5% |
| Interquartile Range (IQR) | 1.5% | 4.5% |
| Standard Deviation (Sample) | 1.2% | 9.6% |
| Standard Deviation (Population) | 1.2% | 9.5% |
Similar Demographics by 5th Grade
Demographics Similar to Soviet Union by 5th Grade
In terms of 5th grade, the demographic groups most similar to Soviet Union are Immigrants from Greece (97.5%, a difference of 0.010%), Jordanian (97.5%, a difference of 0.010%), Spaniard (97.5%, a difference of 0.010%), Immigrants from Israel (97.5%, a difference of 0.010%), and Hopi (97.5%, a difference of 0.020%).
| Demographics | Rating | Rank | 5th Grade |
| Burmese | 86.1 /100 | #140 | Excellent 97.5% |
| Seminole | 85.8 /100 | #141 | Excellent 97.5% |
| Israelis | 85.5 /100 | #142 | Excellent 97.5% |
| Immigrants | North Macedonia | 85.4 /100 | #143 | Excellent 97.5% |
| Immigrants | Greece | 83.2 /100 | #144 | Excellent 97.5% |
| Jordanians | 82.6 /100 | #145 | Excellent 97.5% |
| Spaniards | 81.9 /100 | #146 | Excellent 97.5% |
| Soviet Union | 81.2 /100 | #147 | Excellent 97.5% |
| Immigrants | Israel | 79.1 /100 | #148 | Good 97.5% |
| Hopi | 78.6 /100 | #149 | Good 97.5% |
| Immigrants | South Central Asia | 78.6 /100 | #150 | Good 97.5% |
| Immigrants | Eastern Europe | 75.0 /100 | #151 | Good 97.4% |
| Ute | 74.9 /100 | #152 | Good 97.4% |
| Alsatians | 74.3 /100 | #153 | Good 97.4% |
| Immigrants | Russia | 71.2 /100 | #154 | Good 97.4% |
Demographics Similar to Japanese by 5th Grade
In terms of 5th grade, the demographic groups most similar to Japanese are Central American Indian (95.7%, a difference of 0.0%), Immigrants from Vietnam (95.8%, a difference of 0.050%), Belizean (95.8%, a difference of 0.070%), Immigrants from Belize (95.7%, a difference of 0.080%), and Immigrants from Nicaragua (95.6%, a difference of 0.090%).
| Demographics | Rating | Rank | 5th Grade |
| Vietnamese | 0.0 /100 | #312 | Tragic 95.9% |
| Bangladeshis | 0.0 /100 | #313 | Tragic 95.9% |
| Immigrants | Portugal | 0.0 /100 | #314 | Tragic 95.9% |
| Nicaraguans | 0.0 /100 | #315 | Tragic 95.9% |
| Immigrants | Ecuador | 0.0 /100 | #316 | Tragic 95.8% |
| Belizeans | 0.0 /100 | #317 | Tragic 95.8% |
| Immigrants | Vietnam | 0.0 /100 | #318 | Tragic 95.8% |
| Japanese | 0.0 /100 | #319 | Tragic 95.7% |
| Central American Indians | 0.0 /100 | #320 | Tragic 95.7% |
| Immigrants | Belize | 0.0 /100 | #321 | Tragic 95.7% |
| Immigrants | Nicaragua | 0.0 /100 | #322 | Tragic 95.6% |
| Immigrants | Fiji | 0.0 /100 | #323 | Tragic 95.6% |
| Hondurans | 0.0 /100 | #324 | Tragic 95.6% |
| Hispanics or Latinos | 0.0 /100 | #325 | Tragic 95.6% |
| Immigrants | Cambodia | 0.0 /100 | #326 | Tragic 95.5% |