Brazilian vs Immigrants from Iraq 10th Grade
COMPARE
Brazilian
Immigrants from Iraq
10th Grade
10th Grade Comparison
Brazilians
Immigrants from Iraq
93.8%
10TH GRADE
63.6/ 100
METRIC RATING
165th/ 347
METRIC RANK
93.8%
10TH GRADE
63.0/ 100
METRIC RATING
166th/ 347
METRIC RANK
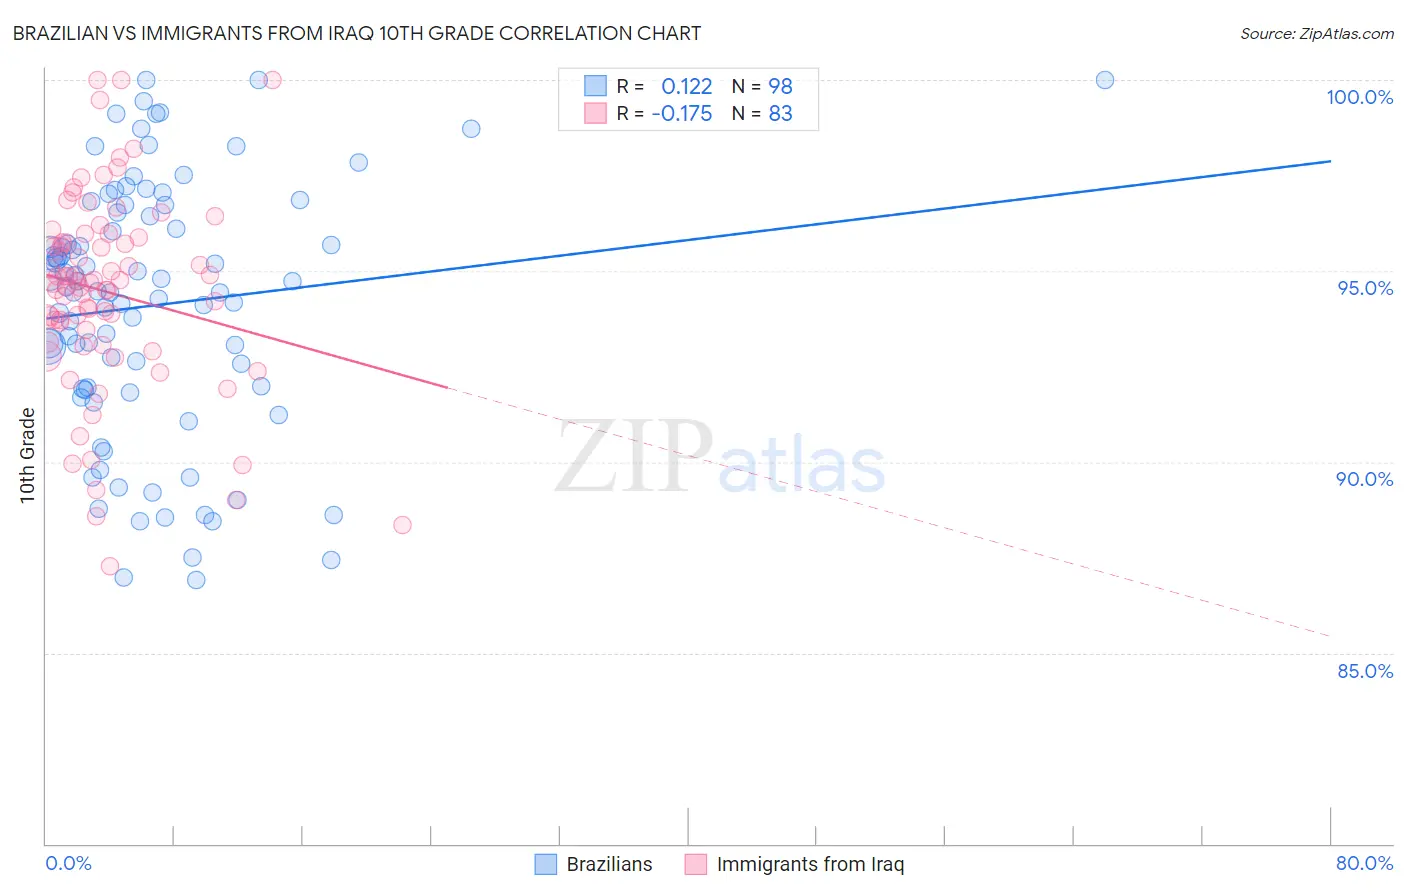
Brazilian vs Immigrants from Iraq 10th Grade Correlation Chart
The statistical analysis conducted on geographies consisting of 323,900,771 people shows a poor positive correlation between the proportion of Brazilians and percentage of population with at least 10th grade education in the United States with a correlation coefficient (R) of 0.122 and weighted average of 93.8%. Similarly, the statistical analysis conducted on geographies consisting of 194,632,332 people shows a poor negative correlation between the proportion of Immigrants from Iraq and percentage of population with at least 10th grade education in the United States with a correlation coefficient (R) of -0.175 and weighted average of 93.8%, a difference of 0.010%.
10th Grade Correlation Summary
| Measurement | Brazilian | Immigrants from Iraq |
| Minimum | 86.9% | 87.3% |
| Maximum | 100.0% | 100.0% |
| Range | 13.1% | 12.7% |
| Mean | 94.1% | 94.4% |
| Median | 94.5% | 94.7% |
| Interquartile 25% (IQ1) | 91.9% | 93.1% |
| Interquartile 75% (IQ3) | 96.5% | 95.9% |
| Interquartile Range (IQR) | 4.6% | 2.8% |
| Standard Deviation (Sample) | 3.3% | 2.6% |
| Standard Deviation (Population) | 3.3% | 2.6% |
Demographics Similar to Brazilians and Immigrants from Iraq by 10th Grade
In terms of 10th grade, the demographic groups most similar to Brazilians are Immigrants from Egypt (93.8%, a difference of 0.010%), Alsatian (93.8%, a difference of 0.040%), Iraqi (93.9%, a difference of 0.050%), Assyrian/Chaldean/Syriac (93.9%, a difference of 0.060%), and Immigrants from Poland (93.9%, a difference of 0.060%). Similarly, the demographic groups most similar to Immigrants from Iraq are Immigrants from Egypt (93.8%, a difference of 0.010%), Alsatian (93.8%, a difference of 0.030%), Iraqi (93.9%, a difference of 0.050%), Chilean (93.9%, a difference of 0.070%), and Pakistani (93.9%, a difference of 0.070%).
| Demographics | Rating | Rank | 10th Grade |
| Spanish | 74.9 /100 | #155 | Good 94.0% |
| Mongolians | 74.4 /100 | #156 | Good 94.0% |
| Kiowa | 73.3 /100 | #157 | Good 93.9% |
| Bermudans | 71.0 /100 | #158 | Good 93.9% |
| Chileans | 70.2 /100 | #159 | Good 93.9% |
| Pakistanis | 70.1 /100 | #160 | Good 93.9% |
| Assyrians/Chaldeans/Syriacs | 69.7 /100 | #161 | Good 93.9% |
| Immigrants | Poland | 69.6 /100 | #162 | Good 93.9% |
| Venezuelans | 69.5 /100 | #163 | Good 93.9% |
| Iraqis | 68.1 /100 | #164 | Good 93.9% |
| Brazilians | 63.6 /100 | #165 | Good 93.8% |
| Immigrants | Iraq | 63.0 /100 | #166 | Good 93.8% |
| Immigrants | Egypt | 62.3 /100 | #167 | Good 93.8% |
| Alsatians | 59.4 /100 | #168 | Average 93.8% |
| Immigrants | Spain | 55.9 /100 | #169 | Average 93.8% |
| Immigrants | Venezuela | 53.9 /100 | #170 | Average 93.8% |
| Immigrants | Albania | 52.4 /100 | #171 | Average 93.8% |
| French American Indians | 50.9 /100 | #172 | Average 93.7% |
| Spaniards | 50.3 /100 | #173 | Average 93.7% |
| Argentineans | 50.0 /100 | #174 | Average 93.7% |
| Immigrants | Nepal | 49.6 /100 | #175 | Average 93.7% |