Venezuelan vs Dutch West Indian 9th Grade
COMPARE
Venezuelan
Dutch West Indian
9th Grade
9th Grade Comparison
Venezuelans
Dutch West Indians
95.0%
9TH GRADE
63.6/ 100
METRIC RATING
164th/ 347
METRIC RANK
94.2%
9TH GRADE
2.0/ 100
METRIC RATING
244th/ 347
METRIC RANK
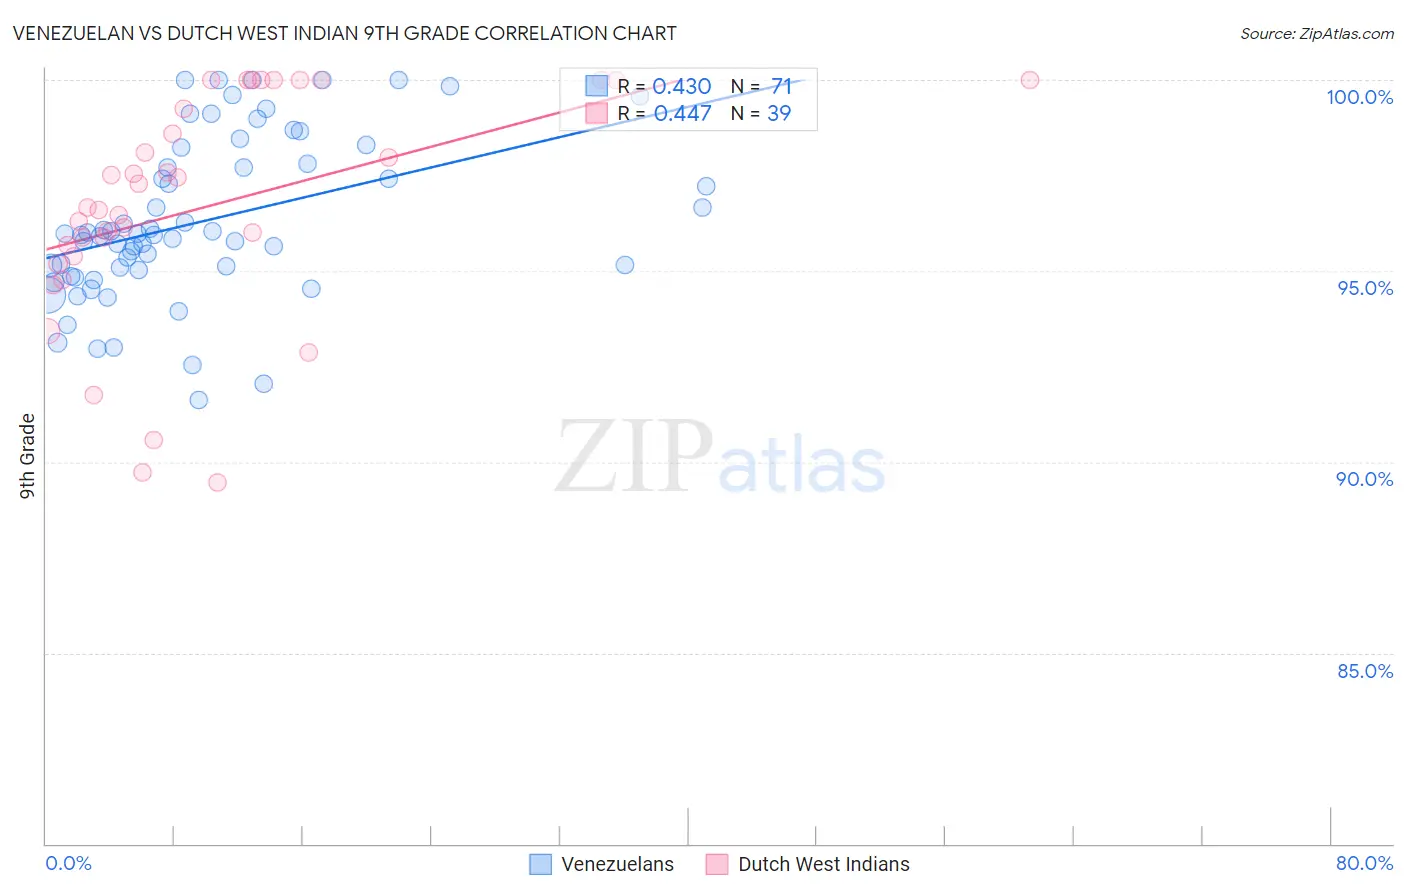
Venezuelan vs Dutch West Indian 9th Grade Correlation Chart
The statistical analysis conducted on geographies consisting of 306,323,638 people shows a moderate positive correlation between the proportion of Venezuelans and percentage of population with at least 9th grade education in the United States with a correlation coefficient (R) of 0.430 and weighted average of 95.0%. Similarly, the statistical analysis conducted on geographies consisting of 85,776,122 people shows a moderate positive correlation between the proportion of Dutch West Indians and percentage of population with at least 9th grade education in the United States with a correlation coefficient (R) of 0.447 and weighted average of 94.2%, a difference of 0.82%.
9th Grade Correlation Summary
| Measurement | Venezuelan | Dutch West Indian |
| Minimum | 91.6% | 89.5% |
| Maximum | 100.0% | 100.0% |
| Range | 8.4% | 10.5% |
| Mean | 96.3% | 96.7% |
| Median | 95.9% | 96.7% |
| Interquartile 25% (IQ1) | 95.0% | 95.4% |
| Interquartile 75% (IQ3) | 97.8% | 100.0% |
| Interquartile Range (IQR) | 2.8% | 4.6% |
| Standard Deviation (Sample) | 2.1% | 2.9% |
| Standard Deviation (Population) | 2.1% | 2.9% |
Similar Demographics by 9th Grade
Demographics Similar to Venezuelans by 9th Grade
In terms of 9th grade, the demographic groups most similar to Venezuelans are Pakistani (95.0%, a difference of 0.0%), Blackfeet (95.0%, a difference of 0.010%), Ute (95.0%, a difference of 0.010%), Immigrants from Italy (95.0%, a difference of 0.020%), and French American Indian (95.0%, a difference of 0.020%).
| Demographics | Rating | Rank | 9th Grade |
| Mongolians | 73.0 /100 | #157 | Good 95.0% |
| Egyptians | 70.1 /100 | #158 | Good 95.0% |
| Immigrants | Ukraine | 67.4 /100 | #159 | Good 95.0% |
| Immigrants | Italy | 66.6 /100 | #160 | Good 95.0% |
| French American Indians | 66.5 /100 | #161 | Good 95.0% |
| Bermudans | 65.8 /100 | #162 | Good 95.0% |
| Pakistanis | 64.1 /100 | #163 | Good 95.0% |
| Venezuelans | 63.6 /100 | #164 | Good 95.0% |
| Blackfeet | 62.6 /100 | #165 | Good 95.0% |
| Ute | 62.6 /100 | #166 | Good 95.0% |
| Immigrants | Brazil | 61.1 /100 | #167 | Good 95.0% |
| Chileans | 60.7 /100 | #168 | Good 95.0% |
| Spaniards | 59.6 /100 | #169 | Average 94.9% |
| Alsatians | 58.6 /100 | #170 | Average 94.9% |
| Colville | 58.5 /100 | #171 | Average 94.9% |
Demographics Similar to Dutch West Indians by 9th Grade
In terms of 9th grade, the demographic groups most similar to Dutch West Indians are Immigrants from Middle Africa (94.2%, a difference of 0.010%), Immigrants from Cameroon (94.2%, a difference of 0.010%), Paiute (94.2%, a difference of 0.010%), Senegalese (94.2%, a difference of 0.010%), and Afghan (94.2%, a difference of 0.020%).
| Demographics | Rating | Rank | 9th Grade |
| Koreans | 2.9 /100 | #237 | Tragic 94.3% |
| South American Indians | 2.8 /100 | #238 | Tragic 94.3% |
| Immigrants | China | 2.8 /100 | #239 | Tragic 94.3% |
| Immigrants | Ethiopia | 2.7 /100 | #240 | Tragic 94.3% |
| Spanish Americans | 2.6 /100 | #241 | Tragic 94.2% |
| Immigrants | Middle Africa | 2.2 /100 | #242 | Tragic 94.2% |
| Immigrants | Cameroon | 2.1 /100 | #243 | Tragic 94.2% |
| Dutch West Indians | 2.0 /100 | #244 | Tragic 94.2% |
| Paiute | 1.9 /100 | #245 | Tragic 94.2% |
| Senegalese | 1.9 /100 | #246 | Tragic 94.2% |
| Afghans | 1.8 /100 | #247 | Tragic 94.2% |
| Immigrants | Somalia | 1.4 /100 | #248 | Tragic 94.1% |
| Uruguayans | 1.3 /100 | #249 | Tragic 94.1% |
| Immigrants | Hong Kong | 1.3 /100 | #250 | Tragic 94.1% |
| Jamaicans | 1.0 /100 | #251 | Tragic 94.1% |