Venezuelan vs Immigrants from Liberia 9th Grade
COMPARE
Venezuelan
Immigrants from Liberia
9th Grade
9th Grade Comparison
Venezuelans
Immigrants from Liberia
95.0%
9TH GRADE
63.6/ 100
METRIC RATING
164th/ 347
METRIC RANK
94.5%
9TH GRADE
11.8/ 100
METRIC RATING
214th/ 347
METRIC RANK
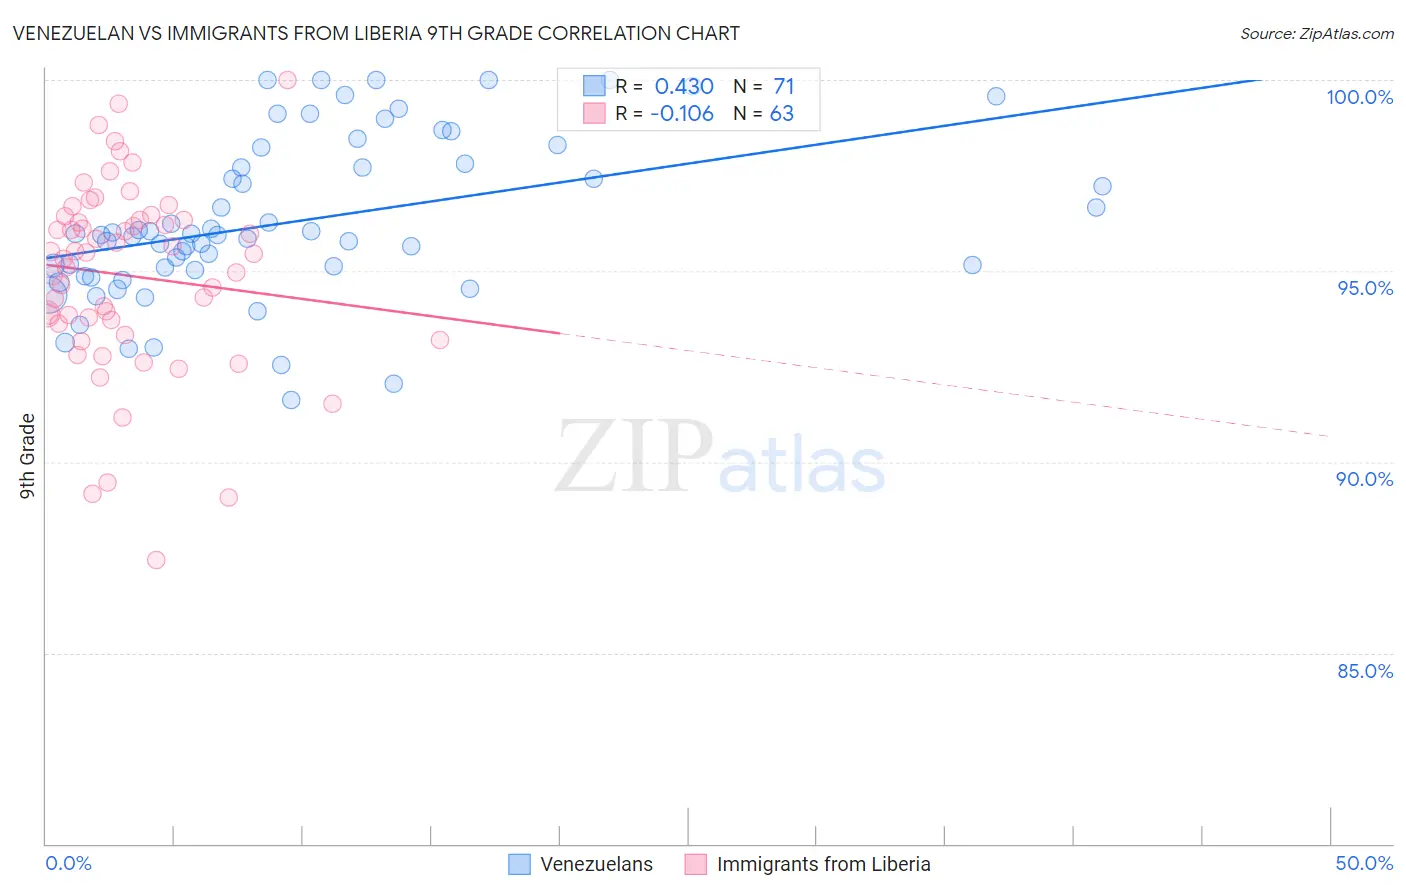
Venezuelan vs Immigrants from Liberia 9th Grade Correlation Chart
The statistical analysis conducted on geographies consisting of 306,323,638 people shows a moderate positive correlation between the proportion of Venezuelans and percentage of population with at least 9th grade education in the United States with a correlation coefficient (R) of 0.430 and weighted average of 95.0%. Similarly, the statistical analysis conducted on geographies consisting of 135,292,614 people shows a poor negative correlation between the proportion of Immigrants from Liberia and percentage of population with at least 9th grade education in the United States with a correlation coefficient (R) of -0.106 and weighted average of 94.5%, a difference of 0.47%.
9th Grade Correlation Summary
| Measurement | Venezuelan | Immigrants from Liberia |
| Minimum | 91.6% | 87.4% |
| Maximum | 100.0% | 100.0% |
| Range | 8.4% | 12.6% |
| Mean | 96.3% | 94.9% |
| Median | 95.9% | 95.5% |
| Interquartile 25% (IQ1) | 95.0% | 93.6% |
| Interquartile 75% (IQ3) | 97.8% | 96.3% |
| Interquartile Range (IQR) | 2.8% | 2.7% |
| Standard Deviation (Sample) | 2.1% | 2.5% |
| Standard Deviation (Population) | 2.1% | 2.5% |
Similar Demographics by 9th Grade
Demographics Similar to Venezuelans by 9th Grade
In terms of 9th grade, the demographic groups most similar to Venezuelans are Pakistani (95.0%, a difference of 0.0%), Blackfeet (95.0%, a difference of 0.010%), Ute (95.0%, a difference of 0.010%), Immigrants from Italy (95.0%, a difference of 0.020%), and French American Indian (95.0%, a difference of 0.020%).
| Demographics | Rating | Rank | 9th Grade |
| Mongolians | 73.0 /100 | #157 | Good 95.0% |
| Egyptians | 70.1 /100 | #158 | Good 95.0% |
| Immigrants | Ukraine | 67.4 /100 | #159 | Good 95.0% |
| Immigrants | Italy | 66.6 /100 | #160 | Good 95.0% |
| French American Indians | 66.5 /100 | #161 | Good 95.0% |
| Bermudans | 65.8 /100 | #162 | Good 95.0% |
| Pakistanis | 64.1 /100 | #163 | Good 95.0% |
| Venezuelans | 63.6 /100 | #164 | Good 95.0% |
| Blackfeet | 62.6 /100 | #165 | Good 95.0% |
| Ute | 62.6 /100 | #166 | Good 95.0% |
| Immigrants | Brazil | 61.1 /100 | #167 | Good 95.0% |
| Chileans | 60.7 /100 | #168 | Good 95.0% |
| Spaniards | 59.6 /100 | #169 | Average 94.9% |
| Alsatians | 58.6 /100 | #170 | Average 94.9% |
| Colville | 58.5 /100 | #171 | Average 94.9% |
Demographics Similar to Immigrants from Liberia by 9th Grade
In terms of 9th grade, the demographic groups most similar to Immigrants from Liberia are Immigrants from Oceania (94.5%, a difference of 0.0%), Immigrants from Indonesia (94.5%, a difference of 0.010%), Immigrants from Malaysia (94.5%, a difference of 0.010%), Immigrants from Syria (94.5%, a difference of 0.010%), and Immigrants from Western Asia (94.5%, a difference of 0.020%).
| Demographics | Rating | Rank | 9th Grade |
| Immigrants | Morocco | 16.3 /100 | #207 | Poor 94.6% |
| Immigrants | Pakistan | 15.5 /100 | #208 | Poor 94.6% |
| Comanche | 14.9 /100 | #209 | Poor 94.6% |
| Immigrants | Chile | 13.4 /100 | #210 | Poor 94.5% |
| Immigrants | Indonesia | 12.3 /100 | #211 | Poor 94.5% |
| Immigrants | Malaysia | 12.2 /100 | #212 | Poor 94.5% |
| Immigrants | Oceania | 12.1 /100 | #213 | Poor 94.5% |
| Immigrants | Liberia | 11.8 /100 | #214 | Poor 94.5% |
| Immigrants | Syria | 11.0 /100 | #215 | Poor 94.5% |
| Immigrants | Western Asia | 10.7 /100 | #216 | Poor 94.5% |
| Asians | 9.9 /100 | #217 | Tragic 94.5% |
| Portuguese | 9.2 /100 | #218 | Tragic 94.5% |
| Africans | 9.0 /100 | #219 | Tragic 94.5% |
| Indians (Asian) | 8.6 /100 | #220 | Tragic 94.5% |
| Immigrants | Eastern Africa | 8.2 /100 | #221 | Tragic 94.5% |