Ottawa vs Dutch West Indian 9th Grade
COMPARE
Ottawa
Dutch West Indian
9th Grade
9th Grade Comparison
Ottawa
Dutch West Indians
96.1%
9TH GRADE
99.9/ 100
METRIC RATING
39th/ 347
METRIC RANK
94.2%
9TH GRADE
2.0/ 100
METRIC RATING
244th/ 347
METRIC RANK
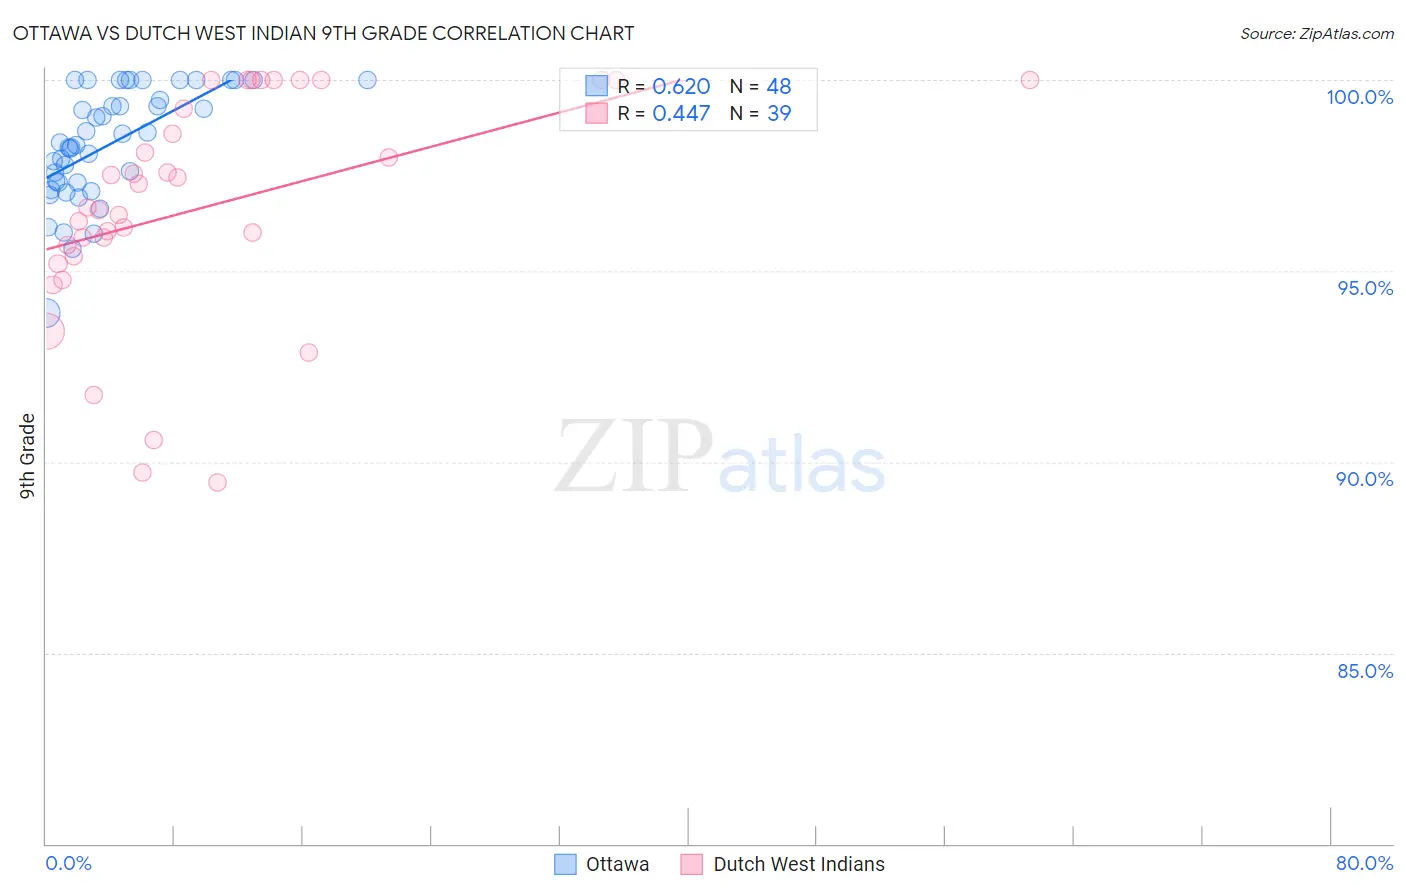
Ottawa vs Dutch West Indian 9th Grade Correlation Chart
The statistical analysis conducted on geographies consisting of 49,956,726 people shows a significant positive correlation between the proportion of Ottawa and percentage of population with at least 9th grade education in the United States with a correlation coefficient (R) of 0.620 and weighted average of 96.1%. Similarly, the statistical analysis conducted on geographies consisting of 85,776,122 people shows a moderate positive correlation between the proportion of Dutch West Indians and percentage of population with at least 9th grade education in the United States with a correlation coefficient (R) of 0.447 and weighted average of 94.2%, a difference of 2.0%.
9th Grade Correlation Summary
| Measurement | Ottawa | Dutch West Indian |
| Minimum | 93.9% | 89.5% |
| Maximum | 100.0% | 100.0% |
| Range | 6.1% | 10.5% |
| Mean | 98.3% | 96.7% |
| Median | 98.3% | 96.7% |
| Interquartile 25% (IQ1) | 97.3% | 95.4% |
| Interquartile 75% (IQ3) | 99.7% | 100.0% |
| Interquartile Range (IQR) | 2.4% | 4.6% |
| Standard Deviation (Sample) | 1.5% | 2.9% |
| Standard Deviation (Population) | 1.4% | 2.9% |
Similar Demographics by 9th Grade
Demographics Similar to Ottawa by 9th Grade
In terms of 9th grade, the demographic groups most similar to Ottawa are Estonian (96.1%, a difference of 0.020%), Immigrants from Scotland (96.1%, a difference of 0.020%), Slavic (96.1%, a difference of 0.020%), Czechoslovakian (96.1%, a difference of 0.030%), and Chippewa (96.1%, a difference of 0.030%).
| Demographics | Rating | Rank | 9th Grade |
| Belgians | 100.0 /100 | #32 | Exceptional 96.3% |
| Luxembourgers | 100.0 /100 | #33 | Exceptional 96.3% |
| Hungarians | 100.0 /100 | #34 | Exceptional 96.2% |
| Bulgarians | 99.9 /100 | #35 | Exceptional 96.2% |
| Northern Europeans | 99.9 /100 | #36 | Exceptional 96.2% |
| Estonians | 99.9 /100 | #37 | Exceptional 96.1% |
| Immigrants | Scotland | 99.9 /100 | #38 | Exceptional 96.1% |
| Ottawa | 99.9 /100 | #39 | Exceptional 96.1% |
| Slavs | 99.9 /100 | #40 | Exceptional 96.1% |
| Czechoslovakians | 99.9 /100 | #41 | Exceptional 96.1% |
| Chippewa | 99.9 /100 | #42 | Exceptional 96.1% |
| Iranians | 99.9 /100 | #43 | Exceptional 96.1% |
| Alaska Natives | 99.9 /100 | #44 | Exceptional 96.1% |
| Crow | 99.9 /100 | #45 | Exceptional 96.1% |
| Immigrants | India | 99.9 /100 | #46 | Exceptional 96.1% |
Demographics Similar to Dutch West Indians by 9th Grade
In terms of 9th grade, the demographic groups most similar to Dutch West Indians are Immigrants from Middle Africa (94.2%, a difference of 0.010%), Immigrants from Cameroon (94.2%, a difference of 0.010%), Paiute (94.2%, a difference of 0.010%), Senegalese (94.2%, a difference of 0.010%), and Afghan (94.2%, a difference of 0.020%).
| Demographics | Rating | Rank | 9th Grade |
| Koreans | 2.9 /100 | #237 | Tragic 94.3% |
| South American Indians | 2.8 /100 | #238 | Tragic 94.3% |
| Immigrants | China | 2.8 /100 | #239 | Tragic 94.3% |
| Immigrants | Ethiopia | 2.7 /100 | #240 | Tragic 94.3% |
| Spanish Americans | 2.6 /100 | #241 | Tragic 94.2% |
| Immigrants | Middle Africa | 2.2 /100 | #242 | Tragic 94.2% |
| Immigrants | Cameroon | 2.1 /100 | #243 | Tragic 94.2% |
| Dutch West Indians | 2.0 /100 | #244 | Tragic 94.2% |
| Paiute | 1.9 /100 | #245 | Tragic 94.2% |
| Senegalese | 1.9 /100 | #246 | Tragic 94.2% |
| Afghans | 1.8 /100 | #247 | Tragic 94.2% |
| Immigrants | Somalia | 1.4 /100 | #248 | Tragic 94.1% |
| Uruguayans | 1.3 /100 | #249 | Tragic 94.1% |
| Immigrants | Hong Kong | 1.3 /100 | #250 | Tragic 94.1% |
| Jamaicans | 1.0 /100 | #251 | Tragic 94.1% |