Immigrants from Dominican Republic vs Immigrants from Afghanistan 12th Grade, No Diploma
COMPARE
Immigrants from Dominican Republic
Immigrants from Afghanistan
12th Grade, No Diploma
12th Grade, No Diploma Comparison
Immigrants from Dominican Republic
Immigrants from Afghanistan
84.9%
12TH GRADE, NO DIPLOMA
0.0/ 100
METRIC RATING
334th/ 347
METRIC RANK
90.6%
12TH GRADE, NO DIPLOMA
11.0/ 100
METRIC RATING
209th/ 347
METRIC RANK
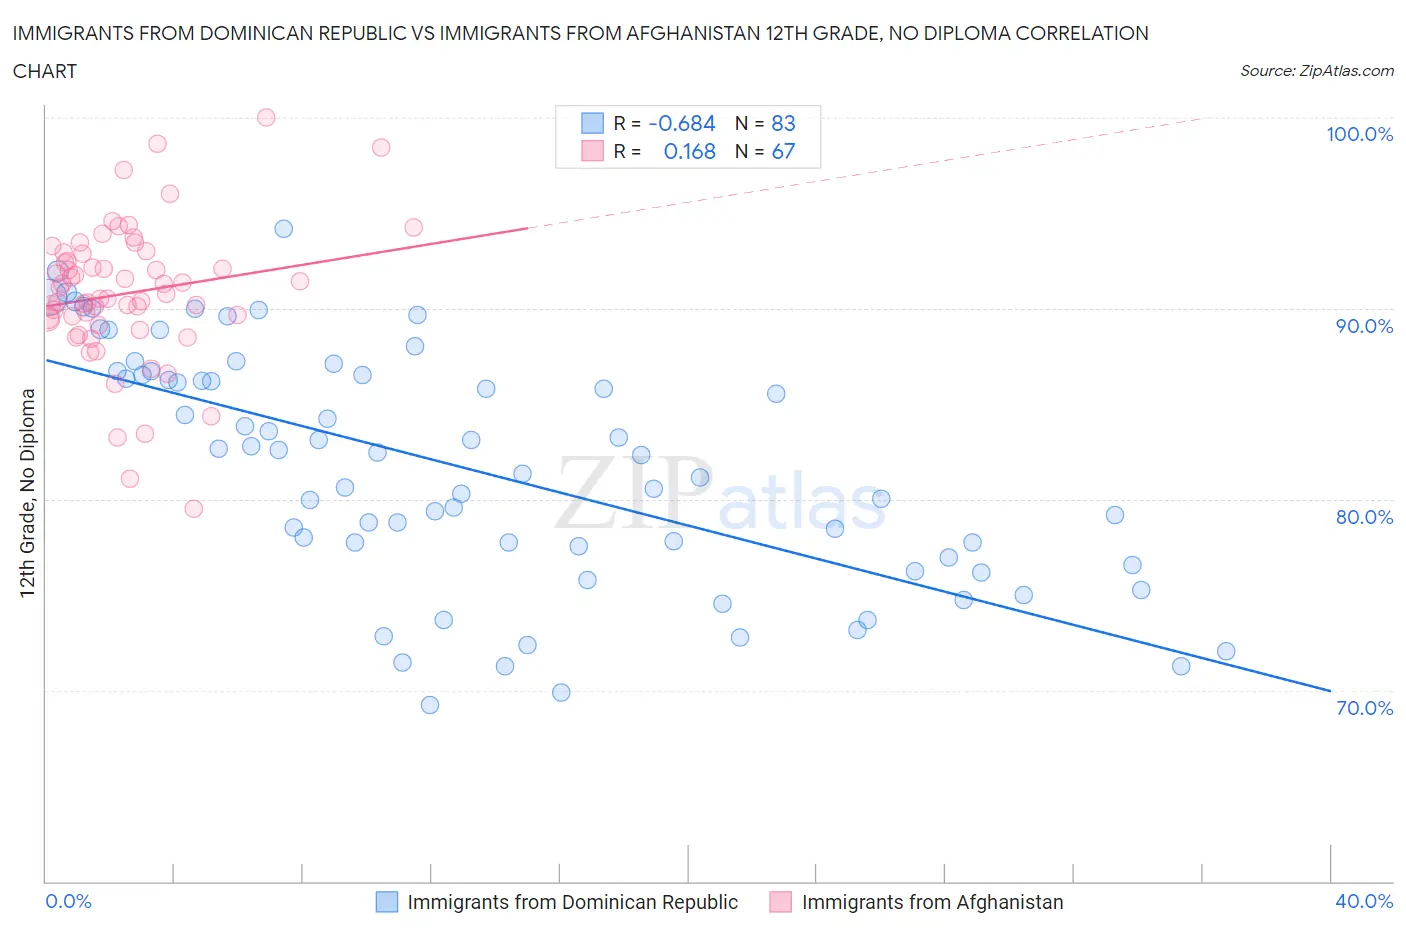
Immigrants from Dominican Republic vs Immigrants from Afghanistan 12th Grade, No Diploma Correlation Chart
The statistical analysis conducted on geographies consisting of 275,144,349 people shows a significant negative correlation between the proportion of Immigrants from Dominican Republic and percentage of population with at least 12th grade (no diploma) education in the United States with a correlation coefficient (R) of -0.684 and weighted average of 84.9%. Similarly, the statistical analysis conducted on geographies consisting of 147,629,579 people shows a poor positive correlation between the proportion of Immigrants from Afghanistan and percentage of population with at least 12th grade (no diploma) education in the United States with a correlation coefficient (R) of 0.168 and weighted average of 90.6%, a difference of 6.7%.
12th Grade, No Diploma Correlation Summary
| Measurement | Immigrants from Dominican Republic | Immigrants from Afghanistan |
| Minimum | 69.2% | 79.5% |
| Maximum | 94.2% | 100.0% |
| Range | 25.0% | 20.5% |
| Mean | 81.6% | 90.8% |
| Median | 82.3% | 90.8% |
| Interquartile 25% (IQ1) | 77.0% | 89.5% |
| Interquartile 75% (IQ3) | 86.5% | 92.9% |
| Interquartile Range (IQR) | 9.5% | 3.4% |
| Standard Deviation (Sample) | 6.2% | 3.7% |
| Standard Deviation (Population) | 6.1% | 3.6% |
Similar Demographics by 12th Grade, No Diploma
Demographics Similar to Immigrants from Dominican Republic by 12th Grade, No Diploma
In terms of 12th grade, no diploma, the demographic groups most similar to Immigrants from Dominican Republic are Immigrants from Yemen (84.8%, a difference of 0.040%), Immigrants from Latin America (85.0%, a difference of 0.14%), Tohono O'odham (84.7%, a difference of 0.18%), Immigrants from Honduras (85.0%, a difference of 0.21%), and Pima (84.6%, a difference of 0.32%).
| Demographics | Rating | Rank | 12th Grade, No Diploma |
| Lumbee | 0.0 /100 | #327 | Tragic 85.7% |
| Hondurans | 0.0 /100 | #328 | Tragic 85.5% |
| Hispanics or Latinos | 0.0 /100 | #329 | Tragic 85.4% |
| Immigrants | Azores | 0.0 /100 | #330 | Tragic 85.3% |
| Central Americans | 0.0 /100 | #331 | Tragic 85.2% |
| Immigrants | Honduras | 0.0 /100 | #332 | Tragic 85.0% |
| Immigrants | Latin America | 0.0 /100 | #333 | Tragic 85.0% |
| Immigrants | Dominican Republic | 0.0 /100 | #334 | Tragic 84.9% |
| Immigrants | Yemen | 0.0 /100 | #335 | Tragic 84.8% |
| Tohono O'odham | 0.0 /100 | #336 | Tragic 84.7% |
| Pima | 0.0 /100 | #337 | Tragic 84.6% |
| Guatemalans | 0.0 /100 | #338 | Tragic 84.6% |
| Salvadorans | 0.0 /100 | #339 | Tragic 84.5% |
| Mexicans | 0.0 /100 | #340 | Tragic 84.1% |
| Immigrants | Guatemala | 0.0 /100 | #341 | Tragic 84.0% |
Demographics Similar to Immigrants from Afghanistan by 12th Grade, No Diploma
In terms of 12th grade, no diploma, the demographic groups most similar to Immigrants from Afghanistan are Immigrants from Micronesia (90.6%, a difference of 0.0%), South American Indian (90.6%, a difference of 0.0%), Portuguese (90.6%, a difference of 0.010%), Armenian (90.6%, a difference of 0.020%), and Somali (90.6%, a difference of 0.020%).
| Demographics | Rating | Rank | 12th Grade, No Diploma |
| Marshallese | 18.2 /100 | #202 | Poor 90.7% |
| Tongans | 16.1 /100 | #203 | Poor 90.7% |
| French American Indians | 15.5 /100 | #204 | Poor 90.7% |
| Immigrants | Sierra Leone | 14.9 /100 | #205 | Poor 90.7% |
| Immigrants | Bolivia | 12.3 /100 | #206 | Poor 90.6% |
| Armenians | 11.6 /100 | #207 | Poor 90.6% |
| Immigrants | Micronesia | 11.0 /100 | #208 | Poor 90.6% |
| Immigrants | Afghanistan | 11.0 /100 | #209 | Poor 90.6% |
| South American Indians | 10.9 /100 | #210 | Poor 90.6% |
| Portuguese | 10.6 /100 | #211 | Poor 90.6% |
| Somalis | 10.2 /100 | #212 | Poor 90.6% |
| Costa Ricans | 9.4 /100 | #213 | Tragic 90.5% |
| Immigrants | Africa | 8.5 /100 | #214 | Tragic 90.5% |
| Arapaho | 7.7 /100 | #215 | Tragic 90.5% |
| Shoshone | 7.5 /100 | #216 | Tragic 90.5% |