Uruguayan vs Zimbabwean Professional Degree
COMPARE
Uruguayan
Zimbabwean
Professional Degree
Professional Degree Comparison
Uruguayans
Zimbabweans
4.6%
PROFESSIONAL DEGREE
80.2/ 100
METRIC RATING
145th/ 347
METRIC RANK
5.2%
PROFESSIONAL DEGREE
99.3/ 100
METRIC RATING
95th/ 347
METRIC RANK
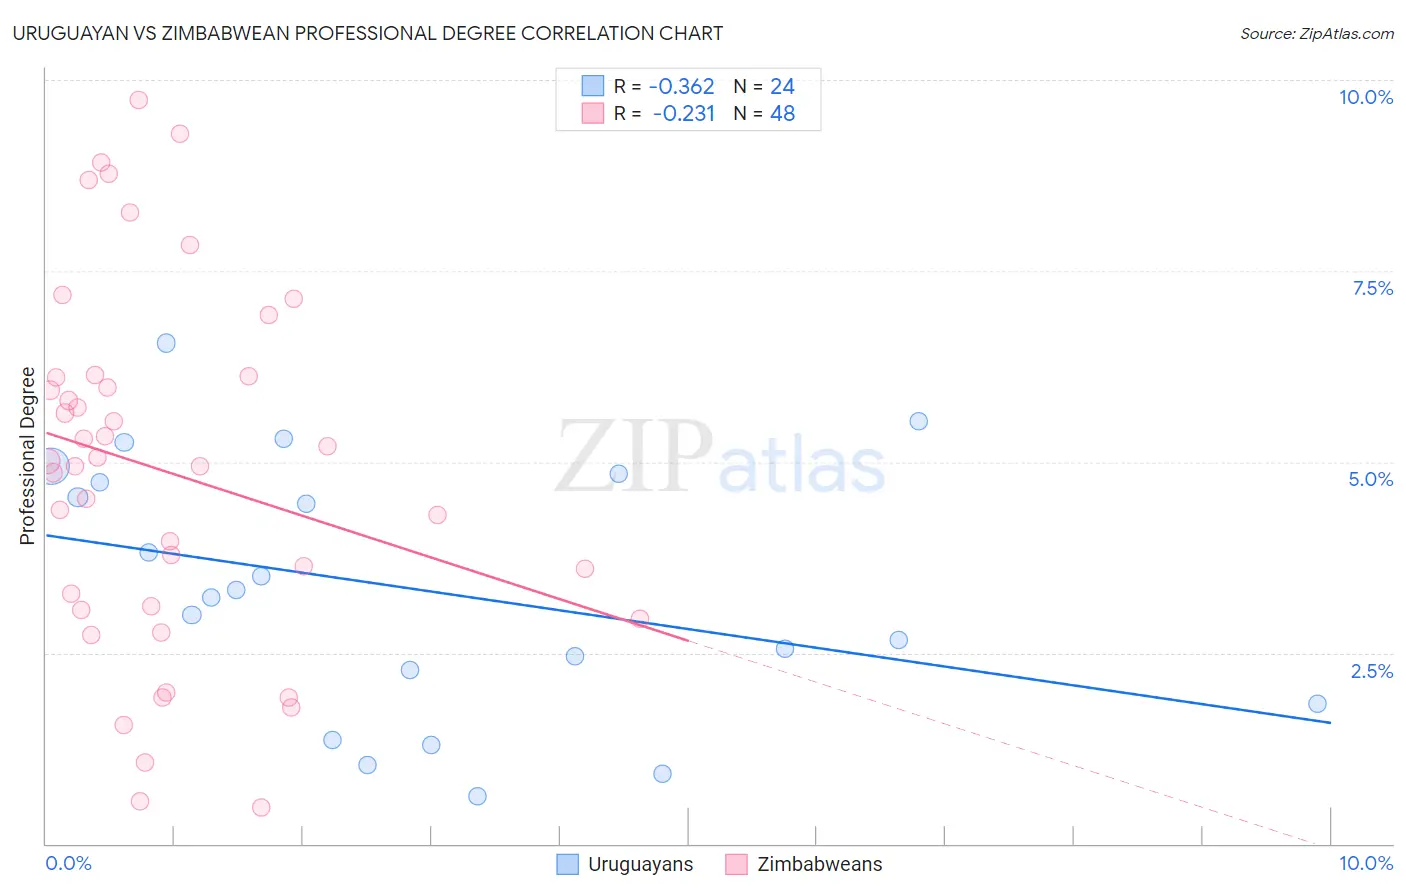
Uruguayan vs Zimbabwean Professional Degree Correlation Chart
The statistical analysis conducted on geographies consisting of 144,737,150 people shows a mild negative correlation between the proportion of Uruguayans and percentage of population with at least professional degree education in the United States with a correlation coefficient (R) of -0.362 and weighted average of 4.6%. Similarly, the statistical analysis conducted on geographies consisting of 69,179,239 people shows a weak negative correlation between the proportion of Zimbabweans and percentage of population with at least professional degree education in the United States with a correlation coefficient (R) of -0.231 and weighted average of 5.2%, a difference of 12.3%.
Professional Degree Correlation Summary
| Measurement | Uruguayan | Zimbabwean |
| Minimum | 0.62% | 0.48% |
| Maximum | 6.6% | 9.7% |
| Range | 5.9% | 9.3% |
| Mean | 3.3% | 4.9% |
| Median | 3.3% | 5.0% |
| Interquartile 25% (IQ1) | 2.1% | 3.1% |
| Interquartile 75% (IQ3) | 4.8% | 6.1% |
| Interquartile Range (IQR) | 2.7% | 3.0% |
| Standard Deviation (Sample) | 1.7% | 2.4% |
| Standard Deviation (Population) | 1.6% | 2.3% |
Similar Demographics by Professional Degree
Demographics Similar to Uruguayans by Professional Degree
In terms of professional degree, the demographic groups most similar to Uruguayans are Immigrants from South America (4.6%, a difference of 0.060%), Hungarian (4.6%, a difference of 0.13%), Sudanese (4.6%, a difference of 0.24%), Luxembourger (4.6%, a difference of 0.31%), and Basque (4.6%, a difference of 0.37%).
| Demographics | Rating | Rank | Professional Degree |
| Afghans | 88.8 /100 | #138 | Excellent 4.7% |
| South Americans | 85.6 /100 | #139 | Excellent 4.7% |
| Canadians | 84.4 /100 | #140 | Excellent 4.7% |
| Basques | 81.8 /100 | #141 | Excellent 4.6% |
| Sudanese | 81.3 /100 | #142 | Excellent 4.6% |
| Hungarians | 80.8 /100 | #143 | Excellent 4.6% |
| Immigrants | South America | 80.5 /100 | #144 | Excellent 4.6% |
| Uruguayans | 80.2 /100 | #145 | Excellent 4.6% |
| Luxembourgers | 78.7 /100 | #146 | Good 4.6% |
| Colombians | 77.7 /100 | #147 | Good 4.6% |
| Slovenes | 76.1 /100 | #148 | Good 4.6% |
| Senegalese | 75.3 /100 | #149 | Good 4.6% |
| Immigrants | Oceania | 73.4 /100 | #150 | Good 4.6% |
| Poles | 72.6 /100 | #151 | Good 4.6% |
| Immigrants | Africa | 72.5 /100 | #152 | Good 4.6% |
Demographics Similar to Zimbabweans by Professional Degree
In terms of professional degree, the demographic groups most similar to Zimbabweans are Alsatian (5.2%, a difference of 0.18%), Northern European (5.2%, a difference of 0.20%), Immigrants from Uzbekistan (5.2%, a difference of 0.41%), Syrian (5.2%, a difference of 0.75%), and Austrian (5.2%, a difference of 0.78%).
| Demographics | Rating | Rank | Professional Degree |
| Egyptians | 99.5 /100 | #88 | Exceptional 5.3% |
| Chileans | 99.5 /100 | #89 | Exceptional 5.3% |
| Immigrants | Scotland | 99.5 /100 | #90 | Exceptional 5.3% |
| Laotians | 99.5 /100 | #91 | Exceptional 5.2% |
| Immigrants | Eastern Europe | 99.5 /100 | #92 | Exceptional 5.2% |
| Northern Europeans | 99.3 /100 | #93 | Exceptional 5.2% |
| Alsatians | 99.3 /100 | #94 | Exceptional 5.2% |
| Zimbabweans | 99.3 /100 | #95 | Exceptional 5.2% |
| Immigrants | Uzbekistan | 99.2 /100 | #96 | Exceptional 5.2% |
| Syrians | 99.1 /100 | #97 | Exceptional 5.2% |
| Austrians | 99.1 /100 | #98 | Exceptional 5.2% |
| Immigrants | Italy | 99.1 /100 | #99 | Exceptional 5.2% |
| Ugandans | 98.8 /100 | #100 | Exceptional 5.1% |
| Immigrants | Egypt | 98.5 /100 | #101 | Exceptional 5.1% |
| Ukrainians | 98.5 /100 | #102 | Exceptional 5.1% |