Uruguayan vs Immigrants from Sri Lanka Professional Degree
COMPARE
Uruguayan
Immigrants from Sri Lanka
Professional Degree
Professional Degree Comparison
Uruguayans
Immigrants from Sri Lanka
4.6%
PROFESSIONAL DEGREE
80.2/ 100
METRIC RATING
145th/ 347
METRIC RANK
6.2%
PROFESSIONAL DEGREE
100.0/ 100
METRIC RATING
29th/ 347
METRIC RANK
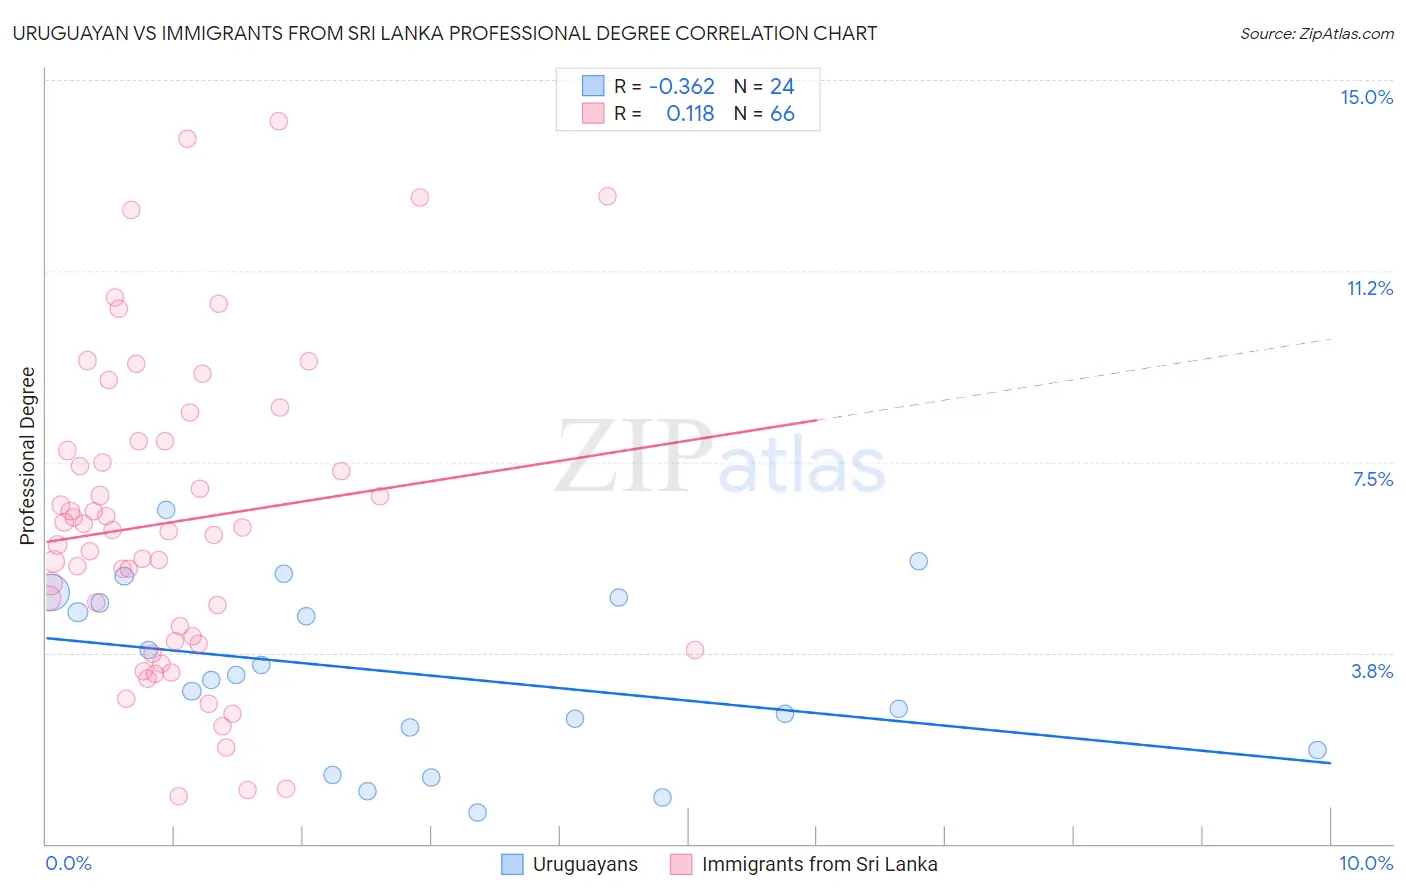
Uruguayan vs Immigrants from Sri Lanka Professional Degree Correlation Chart
The statistical analysis conducted on geographies consisting of 144,737,150 people shows a mild negative correlation between the proportion of Uruguayans and percentage of population with at least professional degree education in the United States with a correlation coefficient (R) of -0.362 and weighted average of 4.6%. Similarly, the statistical analysis conducted on geographies consisting of 149,679,054 people shows a poor positive correlation between the proportion of Immigrants from Sri Lanka and percentage of population with at least professional degree education in the United States with a correlation coefficient (R) of 0.118 and weighted average of 6.2%, a difference of 33.2%.
Professional Degree Correlation Summary
| Measurement | Uruguayan | Immigrants from Sri Lanka |
| Minimum | 0.62% | 0.94% |
| Maximum | 6.6% | 14.2% |
| Range | 5.9% | 13.3% |
| Mean | 3.3% | 6.3% |
| Median | 3.3% | 6.2% |
| Interquartile 25% (IQ1) | 2.1% | 4.0% |
| Interquartile 75% (IQ3) | 4.8% | 7.9% |
| Interquartile Range (IQR) | 2.7% | 3.9% |
| Standard Deviation (Sample) | 1.7% | 3.1% |
| Standard Deviation (Population) | 1.6% | 3.0% |
Similar Demographics by Professional Degree
Demographics Similar to Uruguayans by Professional Degree
In terms of professional degree, the demographic groups most similar to Uruguayans are Immigrants from South America (4.6%, a difference of 0.060%), Hungarian (4.6%, a difference of 0.13%), Sudanese (4.6%, a difference of 0.24%), Luxembourger (4.6%, a difference of 0.31%), and Basque (4.6%, a difference of 0.37%).
| Demographics | Rating | Rank | Professional Degree |
| Afghans | 88.8 /100 | #138 | Excellent 4.7% |
| South Americans | 85.6 /100 | #139 | Excellent 4.7% |
| Canadians | 84.4 /100 | #140 | Excellent 4.7% |
| Basques | 81.8 /100 | #141 | Excellent 4.6% |
| Sudanese | 81.3 /100 | #142 | Excellent 4.6% |
| Hungarians | 80.8 /100 | #143 | Excellent 4.6% |
| Immigrants | South America | 80.5 /100 | #144 | Excellent 4.6% |
| Uruguayans | 80.2 /100 | #145 | Excellent 4.6% |
| Luxembourgers | 78.7 /100 | #146 | Good 4.6% |
| Colombians | 77.7 /100 | #147 | Good 4.6% |
| Slovenes | 76.1 /100 | #148 | Good 4.6% |
| Senegalese | 75.3 /100 | #149 | Good 4.6% |
| Immigrants | Oceania | 73.4 /100 | #150 | Good 4.6% |
| Poles | 72.6 /100 | #151 | Good 4.6% |
| Immigrants | Africa | 72.5 /100 | #152 | Good 4.6% |
Demographics Similar to Immigrants from Sri Lanka by Professional Degree
In terms of professional degree, the demographic groups most similar to Immigrants from Sri Lanka are Immigrants from Turkey (6.2%, a difference of 0.0%), Immigrants from India (6.2%, a difference of 0.12%), Thai (6.1%, a difference of 0.35%), Burmese (6.1%, a difference of 0.39%), and Mongolian (6.1%, a difference of 0.52%).
| Demographics | Rating | Rank | Professional Degree |
| Immigrants | Japan | 100.0 /100 | #22 | Exceptional 6.4% |
| Russians | 100.0 /100 | #23 | Exceptional 6.3% |
| Immigrants | Spain | 100.0 /100 | #24 | Exceptional 6.3% |
| Immigrants | Ireland | 100.0 /100 | #25 | Exceptional 6.3% |
| Latvians | 100.0 /100 | #26 | Exceptional 6.2% |
| Immigrants | Northern Europe | 100.0 /100 | #27 | Exceptional 6.2% |
| Turks | 100.0 /100 | #28 | Exceptional 6.2% |
| Immigrants | Sri Lanka | 100.0 /100 | #29 | Exceptional 6.2% |
| Immigrants | Turkey | 100.0 /100 | #30 | Exceptional 6.2% |
| Immigrants | India | 100.0 /100 | #31 | Exceptional 6.2% |
| Thais | 100.0 /100 | #32 | Exceptional 6.1% |
| Burmese | 100.0 /100 | #33 | Exceptional 6.1% |
| Mongolians | 100.0 /100 | #34 | Exceptional 6.1% |
| Immigrants | Korea | 100.0 /100 | #35 | Exceptional 6.1% |
| Immigrants | Russia | 100.0 /100 | #36 | Exceptional 6.0% |