Immigrants from Guyana vs Zimbabwean Professional Degree
COMPARE
Immigrants from Guyana
Zimbabwean
Professional Degree
Professional Degree Comparison
Immigrants from Guyana
Zimbabweans
3.7%
PROFESSIONAL DEGREE
1.0/ 100
METRIC RATING
261st/ 347
METRIC RANK
5.2%
PROFESSIONAL DEGREE
99.3/ 100
METRIC RATING
95th/ 347
METRIC RANK
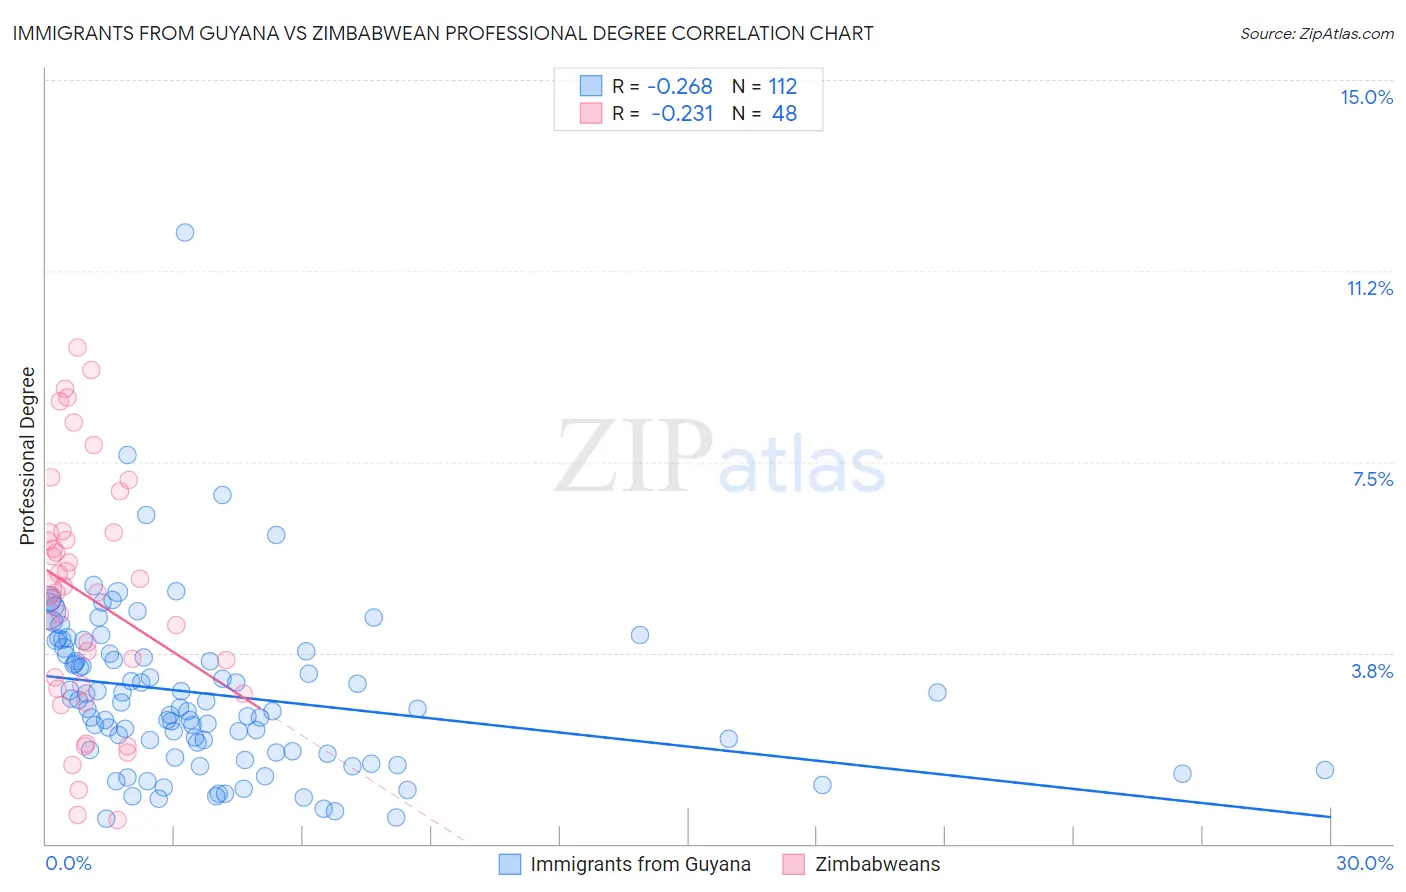
Immigrants from Guyana vs Zimbabwean Professional Degree Correlation Chart
The statistical analysis conducted on geographies consisting of 183,575,789 people shows a weak negative correlation between the proportion of Immigrants from Guyana and percentage of population with at least professional degree education in the United States with a correlation coefficient (R) of -0.268 and weighted average of 3.7%. Similarly, the statistical analysis conducted on geographies consisting of 69,179,239 people shows a weak negative correlation between the proportion of Zimbabweans and percentage of population with at least professional degree education in the United States with a correlation coefficient (R) of -0.231 and weighted average of 5.2%, a difference of 41.9%.
Professional Degree Correlation Summary
| Measurement | Immigrants from Guyana | Zimbabwean |
| Minimum | 0.50% | 0.48% |
| Maximum | 12.0% | 9.7% |
| Range | 11.5% | 9.3% |
| Mean | 2.9% | 4.9% |
| Median | 2.7% | 5.0% |
| Interquartile 25% (IQ1) | 1.8% | 3.1% |
| Interquartile 75% (IQ3) | 3.8% | 6.1% |
| Interquartile Range (IQR) | 2.0% | 3.0% |
| Standard Deviation (Sample) | 1.6% | 2.4% |
| Standard Deviation (Population) | 1.6% | 2.3% |
Similar Demographics by Professional Degree
Demographics Similar to Immigrants from Guyana by Professional Degree
In terms of professional degree, the demographic groups most similar to Immigrants from Guyana are U.S. Virgin Islander (3.7%, a difference of 0.010%), Indonesian (3.7%, a difference of 0.18%), African (3.7%, a difference of 0.19%), Immigrants from St. Vincent and the Grenadines (3.7%, a difference of 0.41%), and Bahamian (3.7%, a difference of 0.49%).
| Demographics | Rating | Rank | Professional Degree |
| Tongans | 1.3 /100 | #254 | Tragic 3.7% |
| Osage | 1.2 /100 | #255 | Tragic 3.7% |
| Iroquois | 1.2 /100 | #256 | Tragic 3.7% |
| Bahamians | 1.1 /100 | #257 | Tragic 3.7% |
| Immigrants | St. Vincent and the Grenadines | 1.1 /100 | #258 | Tragic 3.7% |
| Africans | 1.0 /100 | #259 | Tragic 3.7% |
| Indonesians | 1.0 /100 | #260 | Tragic 3.7% |
| Immigrants | Guyana | 1.0 /100 | #261 | Tragic 3.7% |
| U.S. Virgin Islanders | 1.0 /100 | #262 | Tragic 3.7% |
| Hopi | 0.9 /100 | #263 | Tragic 3.6% |
| Immigrants | Cambodia | 0.9 /100 | #264 | Tragic 3.6% |
| Immigrants | Congo | 0.8 /100 | #265 | Tragic 3.6% |
| Central American Indians | 0.8 /100 | #266 | Tragic 3.6% |
| Delaware | 0.7 /100 | #267 | Tragic 3.6% |
| Aleuts | 0.7 /100 | #268 | Tragic 3.6% |
Demographics Similar to Zimbabweans by Professional Degree
In terms of professional degree, the demographic groups most similar to Zimbabweans are Alsatian (5.2%, a difference of 0.18%), Northern European (5.2%, a difference of 0.20%), Immigrants from Uzbekistan (5.2%, a difference of 0.41%), Syrian (5.2%, a difference of 0.75%), and Austrian (5.2%, a difference of 0.78%).
| Demographics | Rating | Rank | Professional Degree |
| Egyptians | 99.5 /100 | #88 | Exceptional 5.3% |
| Chileans | 99.5 /100 | #89 | Exceptional 5.3% |
| Immigrants | Scotland | 99.5 /100 | #90 | Exceptional 5.3% |
| Laotians | 99.5 /100 | #91 | Exceptional 5.2% |
| Immigrants | Eastern Europe | 99.5 /100 | #92 | Exceptional 5.2% |
| Northern Europeans | 99.3 /100 | #93 | Exceptional 5.2% |
| Alsatians | 99.3 /100 | #94 | Exceptional 5.2% |
| Zimbabweans | 99.3 /100 | #95 | Exceptional 5.2% |
| Immigrants | Uzbekistan | 99.2 /100 | #96 | Exceptional 5.2% |
| Syrians | 99.1 /100 | #97 | Exceptional 5.2% |
| Austrians | 99.1 /100 | #98 | Exceptional 5.2% |
| Immigrants | Italy | 99.1 /100 | #99 | Exceptional 5.2% |
| Ugandans | 98.8 /100 | #100 | Exceptional 5.1% |
| Immigrants | Egypt | 98.5 /100 | #101 | Exceptional 5.1% |
| Ukrainians | 98.5 /100 | #102 | Exceptional 5.1% |