Uruguayan vs Australian 3rd Grade
COMPARE
Uruguayan
Australian
3rd Grade
3rd Grade Comparison
Uruguayans
Australians
97.5%
3RD GRADE
5.0/ 100
METRIC RATING
221st/ 347
METRIC RANK
98.3%
3RD GRADE
99.8/ 100
METRIC RATING
51st/ 347
METRIC RANK
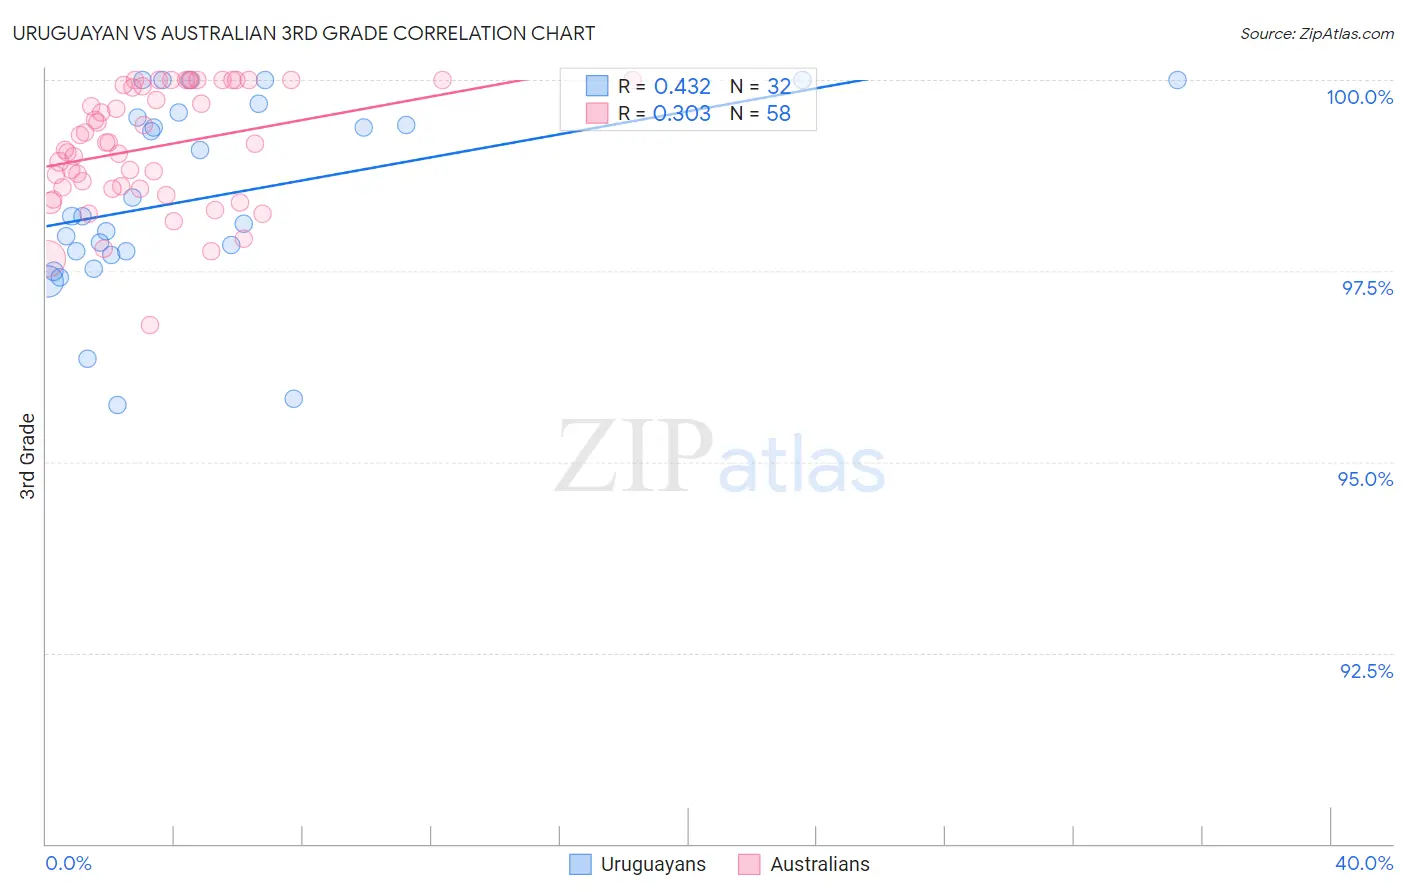
Uruguayan vs Australian 3rd Grade Correlation Chart
The statistical analysis conducted on geographies consisting of 144,782,794 people shows a moderate positive correlation between the proportion of Uruguayans and percentage of population with at least 3rd grade education in the United States with a correlation coefficient (R) of 0.432 and weighted average of 97.5%. Similarly, the statistical analysis conducted on geographies consisting of 224,153,392 people shows a mild positive correlation between the proportion of Australians and percentage of population with at least 3rd grade education in the United States with a correlation coefficient (R) of 0.303 and weighted average of 98.3%, a difference of 0.78%.
3rd Grade Correlation Summary
| Measurement | Uruguayan | Australian |
| Minimum | 95.7% | 96.8% |
| Maximum | 100.0% | 100.0% |
| Range | 4.3% | 3.2% |
| Mean | 98.5% | 99.1% |
| Median | 98.2% | 99.2% |
| Interquartile 25% (IQ1) | 97.7% | 98.6% |
| Interquartile 75% (IQ3) | 99.5% | 99.9% |
| Interquartile Range (IQR) | 1.8% | 1.4% |
| Standard Deviation (Sample) | 1.2% | 0.77% |
| Standard Deviation (Population) | 1.2% | 0.77% |
Similar Demographics by 3rd Grade
Demographics Similar to Uruguayans by 3rd Grade
In terms of 3rd grade, the demographic groups most similar to Uruguayans are Immigrants from Panama (97.5%, a difference of 0.0%), Immigrants from Morocco (97.5%, a difference of 0.0%), South American Indian (97.5%, a difference of 0.010%), Immigrants from Nepal (97.5%, a difference of 0.010%), and Sierra Leonean (97.5%, a difference of 0.010%).
| Demographics | Rating | Rank | 3rd Grade |
| Yuman | 8.4 /100 | #214 | Tragic 97.6% |
| Iraqis | 6.9 /100 | #215 | Tragic 97.5% |
| Samoans | 6.9 /100 | #216 | Tragic 97.5% |
| South American Indians | 5.7 /100 | #217 | Tragic 97.5% |
| Immigrants | Nepal | 5.3 /100 | #218 | Tragic 97.5% |
| Immigrants | Panama | 5.2 /100 | #219 | Tragic 97.5% |
| Immigrants | Morocco | 5.0 /100 | #220 | Tragic 97.5% |
| Uruguayans | 5.0 /100 | #221 | Tragic 97.5% |
| Sierra Leoneans | 4.6 /100 | #222 | Tragic 97.5% |
| Immigrants | Syria | 4.4 /100 | #223 | Tragic 97.5% |
| Bahamians | 4.4 /100 | #224 | Tragic 97.5% |
| Tongans | 4.3 /100 | #225 | Tragic 97.5% |
| Sudanese | 4.1 /100 | #226 | Tragic 97.5% |
| Immigrants | Sudan | 3.4 /100 | #227 | Tragic 97.5% |
| Sub-Saharan Africans | 3.2 /100 | #228 | Tragic 97.5% |
Demographics Similar to Australians by 3rd Grade
In terms of 3rd grade, the demographic groups most similar to Australians are Estonian (98.3%, a difference of 0.0%), Celtic (98.3%, a difference of 0.0%), White/Caucasian (98.3%, a difference of 0.0%), Immigrants from Scotland (98.3%, a difference of 0.010%), and Ottawa (98.3%, a difference of 0.020%).
| Demographics | Rating | Rank | 3rd Grade |
| Hungarians | 99.9 /100 | #44 | Exceptional 98.3% |
| Native Hawaiians | 99.9 /100 | #45 | Exceptional 98.3% |
| Ottawa | 99.8 /100 | #46 | Exceptional 98.3% |
| Czechoslovakians | 99.8 /100 | #47 | Exceptional 98.3% |
| Lumbee | 99.8 /100 | #48 | Exceptional 98.3% |
| Estonians | 99.8 /100 | #49 | Exceptional 98.3% |
| Celtics | 99.8 /100 | #50 | Exceptional 98.3% |
| Australians | 99.8 /100 | #51 | Exceptional 98.3% |
| Whites/Caucasians | 99.8 /100 | #52 | Exceptional 98.3% |
| Immigrants | Scotland | 99.8 /100 | #53 | Exceptional 98.3% |
| Bulgarians | 99.8 /100 | #54 | Exceptional 98.3% |
| Americans | 99.8 /100 | #55 | Exceptional 98.3% |
| Austrians | 99.8 /100 | #56 | Exceptional 98.3% |
| Slavs | 99.7 /100 | #57 | Exceptional 98.3% |
| Greeks | 99.7 /100 | #58 | Exceptional 98.3% |