Turkish vs Panamanian 4th Grade
COMPARE
Turkish
Panamanian
4th Grade
4th Grade Comparison
Turks
Panamanians
97.9%
4TH GRADE
98.2/ 100
METRIC RATING
99th/ 347
METRIC RANK
97.4%
4TH GRADE
31.9/ 100
METRIC RATING
189th/ 347
METRIC RANK
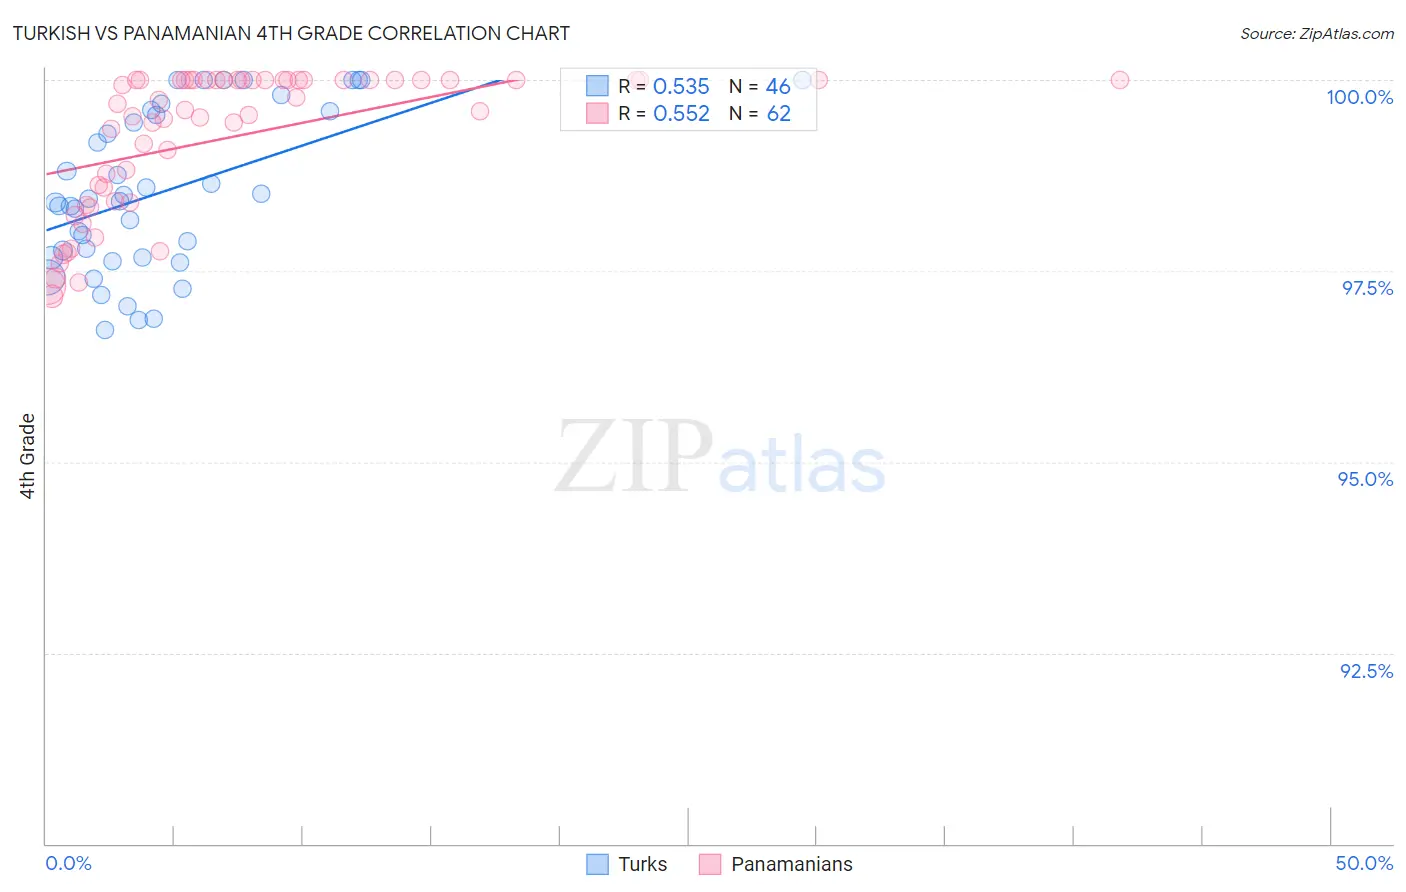
Turkish vs Panamanian 4th Grade Correlation Chart
The statistical analysis conducted on geographies consisting of 271,858,657 people shows a substantial positive correlation between the proportion of Turks and percentage of population with at least 4th grade education in the United States with a correlation coefficient (R) of 0.535 and weighted average of 97.9%. Similarly, the statistical analysis conducted on geographies consisting of 281,248,945 people shows a substantial positive correlation between the proportion of Panamanians and percentage of population with at least 4th grade education in the United States with a correlation coefficient (R) of 0.552 and weighted average of 97.4%, a difference of 0.45%.
4th Grade Correlation Summary
| Measurement | Turkish | Panamanian |
| Minimum | 96.7% | 97.2% |
| Maximum | 100.0% | 100.0% |
| Range | 3.3% | 2.8% |
| Mean | 98.5% | 99.2% |
| Median | 98.4% | 99.6% |
| Interquartile 25% (IQ1) | 97.7% | 98.4% |
| Interquartile 75% (IQ3) | 99.6% | 100.0% |
| Interquartile Range (IQR) | 1.9% | 1.6% |
| Standard Deviation (Sample) | 1.0% | 0.93% |
| Standard Deviation (Population) | 1.0% | 0.92% |
Similar Demographics by 4th Grade
Demographics Similar to Turks by 4th Grade
In terms of 4th grade, the demographic groups most similar to Turks are South African (97.9%, a difference of 0.0%), Yugoslavian (97.9%, a difference of 0.0%), Romanian (97.9%, a difference of 0.010%), Cheyenne (97.9%, a difference of 0.010%), and Cree (97.9%, a difference of 0.010%).
| Demographics | Rating | Rank | 4th Grade |
| Immigrants | Western Europe | 98.7 /100 | #92 | Exceptional 97.9% |
| Immigrants | Ireland | 98.7 /100 | #93 | Exceptional 97.9% |
| Shoshone | 98.7 /100 | #94 | Exceptional 97.9% |
| Immigrants | Germany | 98.5 /100 | #95 | Exceptional 97.9% |
| Romanians | 98.4 /100 | #96 | Exceptional 97.9% |
| Cheyenne | 98.4 /100 | #97 | Exceptional 97.9% |
| South Africans | 98.2 /100 | #98 | Exceptional 97.9% |
| Turks | 98.2 /100 | #99 | Exceptional 97.9% |
| Yugoslavians | 98.1 /100 | #100 | Exceptional 97.9% |
| Cree | 98.1 /100 | #101 | Exceptional 97.9% |
| Choctaw | 97.9 /100 | #102 | Exceptional 97.9% |
| Puget Sound Salish | 97.7 /100 | #103 | Exceptional 97.9% |
| Immigrants | Nonimmigrants | 97.5 /100 | #104 | Exceptional 97.9% |
| German Russians | 97.5 /100 | #105 | Exceptional 97.9% |
| Immigrants | Czechoslovakia | 97.5 /100 | #106 | Exceptional 97.9% |
Demographics Similar to Panamanians by 4th Grade
In terms of 4th grade, the demographic groups most similar to Panamanians are Black/African American (97.4%, a difference of 0.0%), Mongolian (97.5%, a difference of 0.010%), Immigrants from Argentina (97.5%, a difference of 0.010%), Navajo (97.4%, a difference of 0.010%), and Immigrants from Ukraine (97.4%, a difference of 0.010%).
| Demographics | Rating | Rank | 4th Grade |
| Spanish Americans | 39.3 /100 | #182 | Fair 97.5% |
| Argentineans | 39.0 /100 | #183 | Fair 97.5% |
| Pakistanis | 36.2 /100 | #184 | Fair 97.5% |
| Immigrants | Kenya | 35.8 /100 | #185 | Fair 97.5% |
| Dutch West Indians | 35.8 /100 | #186 | Fair 97.5% |
| Mongolians | 34.7 /100 | #187 | Fair 97.5% |
| Immigrants | Argentina | 34.6 /100 | #188 | Fair 97.5% |
| Panamanians | 31.9 /100 | #189 | Fair 97.4% |
| Blacks/African Americans | 31.1 /100 | #190 | Fair 97.4% |
| Navajo | 30.7 /100 | #191 | Fair 97.4% |
| Immigrants | Ukraine | 30.1 /100 | #192 | Fair 97.4% |
| Immigrants | Egypt | 30.1 /100 | #193 | Fair 97.4% |
| Portuguese | 29.2 /100 | #194 | Fair 97.4% |
| Paraguayans | 28.9 /100 | #195 | Fair 97.4% |
| Immigrants | Albania | 27.7 /100 | #196 | Fair 97.4% |