Immigrants from Liberia vs Panamanian 4th Grade
COMPARE
Immigrants from Liberia
Panamanian
4th Grade
4th Grade Comparison
Immigrants from Liberia
Panamanians
97.1%
4TH GRADE
0.8/ 100
METRIC RATING
253rd/ 347
METRIC RANK
97.4%
4TH GRADE
31.9/ 100
METRIC RATING
189th/ 347
METRIC RANK
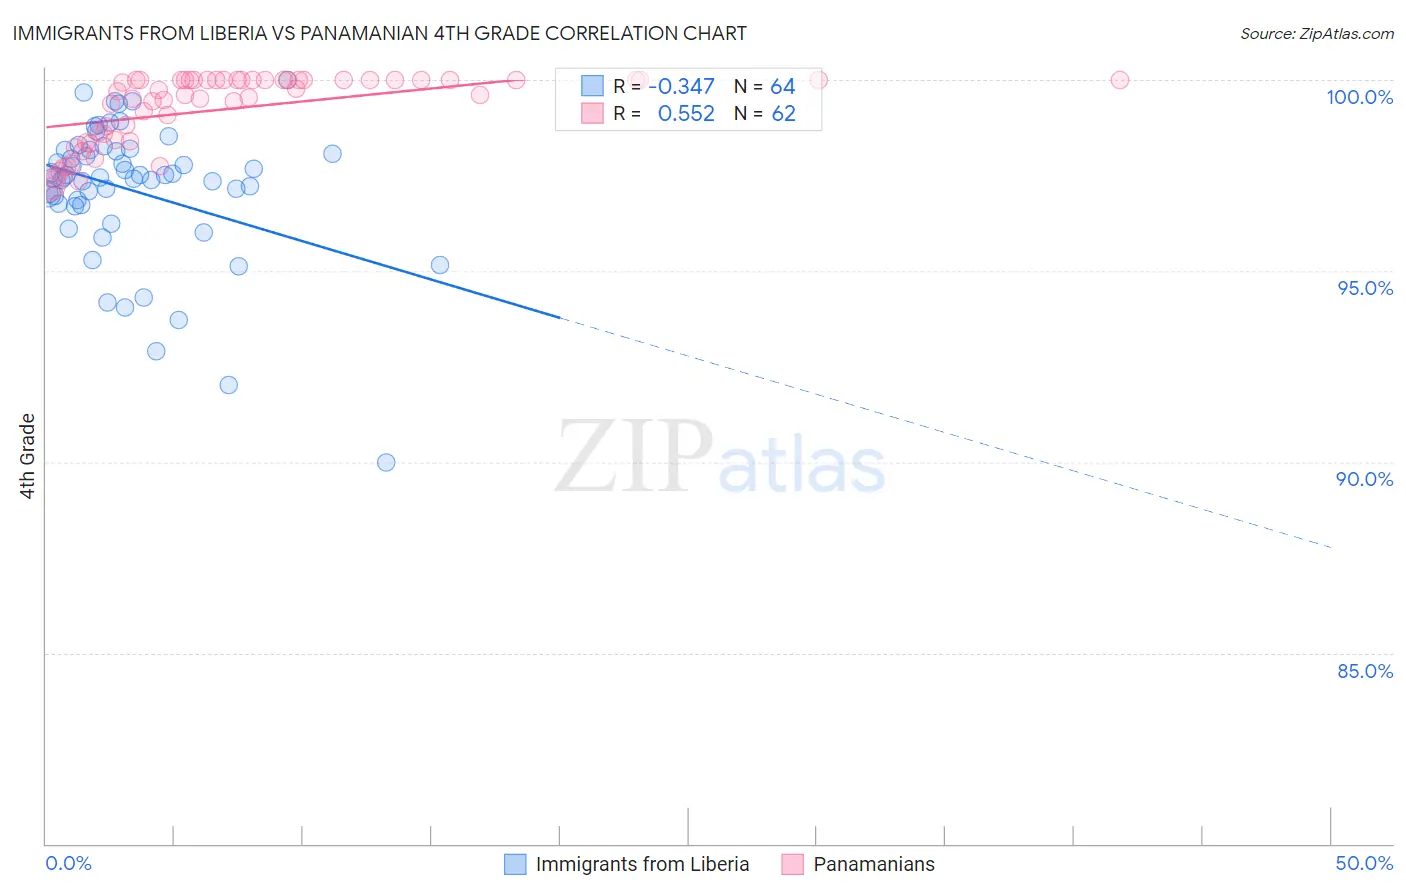
Immigrants from Liberia vs Panamanian 4th Grade Correlation Chart
The statistical analysis conducted on geographies consisting of 135,294,272 people shows a mild negative correlation between the proportion of Immigrants from Liberia and percentage of population with at least 4th grade education in the United States with a correlation coefficient (R) of -0.347 and weighted average of 97.1%. Similarly, the statistical analysis conducted on geographies consisting of 281,248,945 people shows a substantial positive correlation between the proportion of Panamanians and percentage of population with at least 4th grade education in the United States with a correlation coefficient (R) of 0.552 and weighted average of 97.4%, a difference of 0.38%.
4th Grade Correlation Summary
| Measurement | Immigrants from Liberia | Panamanian |
| Minimum | 90.0% | 97.2% |
| Maximum | 100.0% | 100.0% |
| Range | 10.0% | 2.8% |
| Mean | 97.1% | 99.2% |
| Median | 97.4% | 99.6% |
| Interquartile 25% (IQ1) | 96.7% | 98.4% |
| Interquartile 75% (IQ3) | 98.1% | 100.0% |
| Interquartile Range (IQR) | 1.4% | 1.6% |
| Standard Deviation (Sample) | 1.8% | 0.93% |
| Standard Deviation (Population) | 1.8% | 0.92% |
Similar Demographics by 4th Grade
Demographics Similar to Immigrants from Liberia by 4th Grade
In terms of 4th grade, the demographic groups most similar to Immigrants from Liberia are South American (97.1%, a difference of 0.0%), Jamaican (97.1%, a difference of 0.0%), Immigrants from Middle Africa (97.1%, a difference of 0.0%), Immigrants from Africa (97.1%, a difference of 0.010%), and Immigrants from Senegal (97.1%, a difference of 0.010%).
| Demographics | Rating | Rank | 4th Grade |
| Immigrants | Uruguay | 1.2 /100 | #246 | Tragic 97.1% |
| Ethiopians | 1.2 /100 | #247 | Tragic 97.1% |
| Immigrants | Asia | 1.2 /100 | #248 | Tragic 97.1% |
| Immigrants | Africa | 1.0 /100 | #249 | Tragic 97.1% |
| Immigrants | Senegal | 0.9 /100 | #250 | Tragic 97.1% |
| South Americans | 0.8 /100 | #251 | Tragic 97.1% |
| Jamaicans | 0.8 /100 | #252 | Tragic 97.1% |
| Immigrants | Liberia | 0.8 /100 | #253 | Tragic 97.1% |
| Immigrants | Middle Africa | 0.8 /100 | #254 | Tragic 97.1% |
| Peruvians | 0.7 /100 | #255 | Tragic 97.1% |
| Bolivians | 0.7 /100 | #256 | Tragic 97.1% |
| Immigrants | Congo | 0.5 /100 | #257 | Tragic 97.0% |
| Immigrants | Colombia | 0.5 /100 | #258 | Tragic 97.0% |
| Immigrants | Ethiopia | 0.4 /100 | #259 | Tragic 97.0% |
| Immigrants | Sierra Leone | 0.4 /100 | #260 | Tragic 97.0% |
Demographics Similar to Panamanians by 4th Grade
In terms of 4th grade, the demographic groups most similar to Panamanians are Black/African American (97.4%, a difference of 0.0%), Mongolian (97.5%, a difference of 0.010%), Immigrants from Argentina (97.5%, a difference of 0.010%), Navajo (97.4%, a difference of 0.010%), and Immigrants from Ukraine (97.4%, a difference of 0.010%).
| Demographics | Rating | Rank | 4th Grade |
| Spanish Americans | 39.3 /100 | #182 | Fair 97.5% |
| Argentineans | 39.0 /100 | #183 | Fair 97.5% |
| Pakistanis | 36.2 /100 | #184 | Fair 97.5% |
| Immigrants | Kenya | 35.8 /100 | #185 | Fair 97.5% |
| Dutch West Indians | 35.8 /100 | #186 | Fair 97.5% |
| Mongolians | 34.7 /100 | #187 | Fair 97.5% |
| Immigrants | Argentina | 34.6 /100 | #188 | Fair 97.5% |
| Panamanians | 31.9 /100 | #189 | Fair 97.4% |
| Blacks/African Americans | 31.1 /100 | #190 | Fair 97.4% |
| Navajo | 30.7 /100 | #191 | Fair 97.4% |
| Immigrants | Ukraine | 30.1 /100 | #192 | Fair 97.4% |
| Immigrants | Egypt | 30.1 /100 | #193 | Fair 97.4% |
| Portuguese | 29.2 /100 | #194 | Fair 97.4% |
| Paraguayans | 28.9 /100 | #195 | Fair 97.4% |
| Immigrants | Albania | 27.7 /100 | #196 | Fair 97.4% |