Turkish vs Houma 3rd Grade
COMPARE
Turkish
Houma
3rd Grade
3rd Grade Comparison
Turks
Houma
98.1%
3RD GRADE
97.6/ 100
METRIC RATING
104th/ 347
METRIC RANK
97.1%
3RD GRADE
0.1/ 100
METRIC RATING
283rd/ 347
METRIC RANK
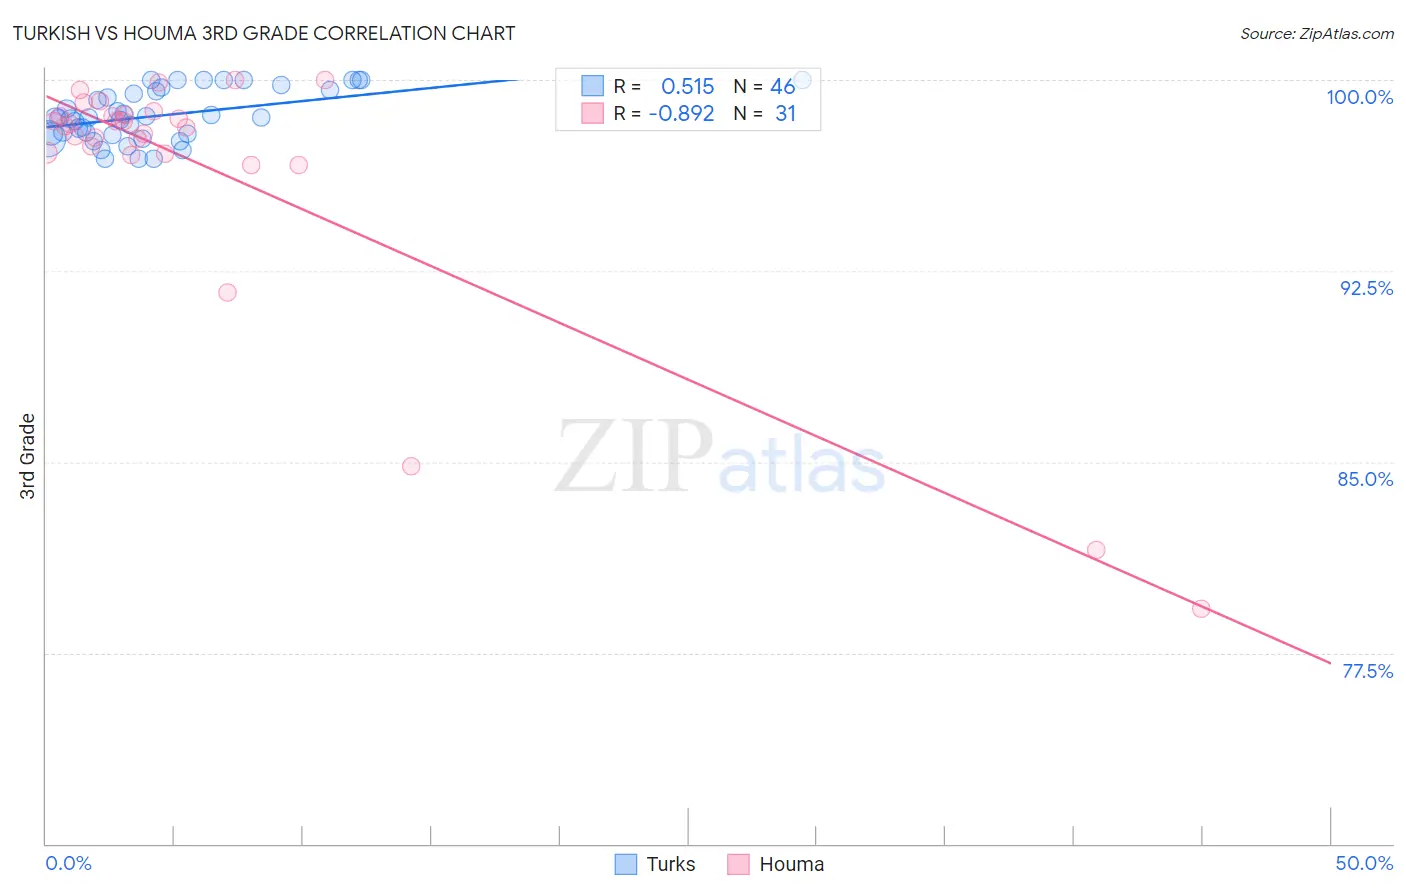
Turkish vs Houma 3rd Grade Correlation Chart
The statistical analysis conducted on geographies consisting of 271,858,657 people shows a substantial positive correlation between the proportion of Turks and percentage of population with at least 3rd grade education in the United States with a correlation coefficient (R) of 0.515 and weighted average of 98.1%. Similarly, the statistical analysis conducted on geographies consisting of 36,795,916 people shows a very strong negative correlation between the proportion of Houma and percentage of population with at least 3rd grade education in the United States with a correlation coefficient (R) of -0.892 and weighted average of 97.1%, a difference of 0.95%.
3rd Grade Correlation Summary
| Measurement | Turkish | Houma |
| Minimum | 96.9% | 79.2% |
| Maximum | 100.0% | 100.0% |
| Range | 3.1% | 20.8% |
| Mean | 98.6% | 96.5% |
| Median | 98.5% | 98.2% |
| Interquartile 25% (IQ1) | 97.9% | 97.1% |
| Interquartile 75% (IQ3) | 99.6% | 98.6% |
| Interquartile Range (IQR) | 1.7% | 1.5% |
| Standard Deviation (Sample) | 0.99% | 5.1% |
| Standard Deviation (Population) | 0.98% | 5.1% |
Similar Demographics by 3rd Grade
Demographics Similar to Turks by 3rd Grade
In terms of 3rd grade, the demographic groups most similar to Turks are Yugoslavian (98.1%, a difference of 0.0%), Romanian (98.1%, a difference of 0.010%), Cree (98.1%, a difference of 0.010%), Puget Sound Salish (98.1%, a difference of 0.010%), and Nonimmigrants (98.1%, a difference of 0.010%).
| Demographics | Rating | Rank | 3rd Grade |
| South Africans | 98.2 /100 | #97 | Exceptional 98.1% |
| Choctaw | 98.0 /100 | #98 | Exceptional 98.1% |
| Romanians | 98.0 /100 | #99 | Exceptional 98.1% |
| Cree | 97.9 /100 | #100 | Exceptional 98.1% |
| Puget Sound Salish | 97.9 /100 | #101 | Exceptional 98.1% |
| Immigrants | Nonimmigrants | 97.8 /100 | #102 | Exceptional 98.1% |
| Yugoslavians | 97.7 /100 | #103 | Exceptional 98.1% |
| Turks | 97.6 /100 | #104 | Exceptional 98.1% |
| German Russians | 97.2 /100 | #105 | Exceptional 98.1% |
| Bhutanese | 97.2 /100 | #106 | Exceptional 98.1% |
| Immigrants | Czechoslovakia | 97.0 /100 | #107 | Exceptional 98.0% |
| Immigrants | Singapore | 96.7 /100 | #108 | Exceptional 98.0% |
| Pima | 96.7 /100 | #109 | Exceptional 98.0% |
| Immigrants | Switzerland | 96.6 /100 | #110 | Exceptional 98.0% |
| Basques | 96.5 /100 | #111 | Exceptional 98.0% |
Demographics Similar to Houma by 3rd Grade
In terms of 3rd grade, the demographic groups most similar to Houma are Afghan (97.1%, a difference of 0.0%), Immigrants from Philippines (97.2%, a difference of 0.020%), Immigrants from Ghana (97.2%, a difference of 0.020%), Barbadian (97.2%, a difference of 0.020%), and Immigrants from Trinidad and Tobago (97.1%, a difference of 0.020%).
| Demographics | Rating | Rank | 3rd Grade |
| Immigrants | Bolivia | 0.1 /100 | #276 | Tragic 97.2% |
| Trinidadians and Tobagonians | 0.1 /100 | #277 | Tragic 97.2% |
| Immigrants | Western Africa | 0.1 /100 | #278 | Tragic 97.2% |
| Immigrants | Philippines | 0.1 /100 | #279 | Tragic 97.2% |
| Immigrants | Ghana | 0.1 /100 | #280 | Tragic 97.2% |
| Barbadians | 0.1 /100 | #281 | Tragic 97.2% |
| Afghans | 0.1 /100 | #282 | Tragic 97.1% |
| Houma | 0.1 /100 | #283 | Tragic 97.1% |
| Immigrants | Trinidad and Tobago | 0.0 /100 | #284 | Tragic 97.1% |
| Immigrants | Hong Kong | 0.0 /100 | #285 | Tragic 97.1% |
| Immigrants | Barbados | 0.0 /100 | #286 | Tragic 97.1% |
| Immigrants | St. Vincent and the Grenadines | 0.0 /100 | #287 | Tragic 97.1% |
| Immigrants | West Indies | 0.0 /100 | #288 | Tragic 97.1% |
| Immigrants | Thailand | 0.0 /100 | #289 | Tragic 97.1% |
| Immigrants | Portugal | 0.0 /100 | #290 | Tragic 97.0% |