Immigrants from South Central Asia vs Houma 3rd Grade
COMPARE
Immigrants from South Central Asia
Houma
3rd Grade
3rd Grade Comparison
Immigrants from South Central Asia
Houma
97.8%
3RD GRADE
69.5/ 100
METRIC RATING
152nd/ 347
METRIC RANK
97.1%
3RD GRADE
0.1/ 100
METRIC RATING
283rd/ 347
METRIC RANK
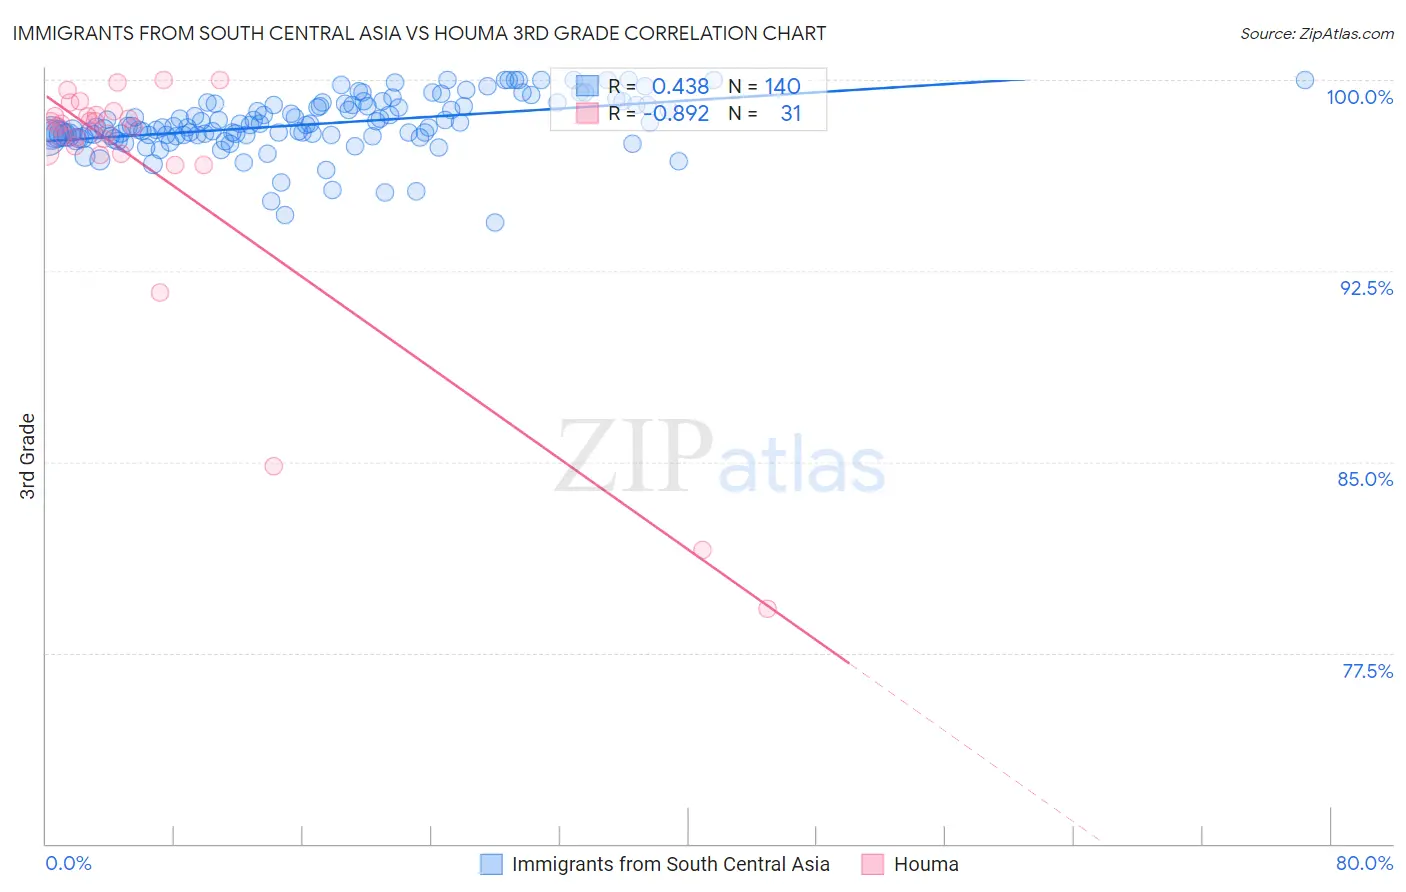
Immigrants from South Central Asia vs Houma 3rd Grade Correlation Chart
The statistical analysis conducted on geographies consisting of 473,113,181 people shows a moderate positive correlation between the proportion of Immigrants from South Central Asia and percentage of population with at least 3rd grade education in the United States with a correlation coefficient (R) of 0.438 and weighted average of 97.8%. Similarly, the statistical analysis conducted on geographies consisting of 36,795,916 people shows a very strong negative correlation between the proportion of Houma and percentage of population with at least 3rd grade education in the United States with a correlation coefficient (R) of -0.892 and weighted average of 97.1%, a difference of 0.71%.
3rd Grade Correlation Summary
| Measurement | Immigrants from South Central Asia | Houma |
| Minimum | 94.4% | 79.2% |
| Maximum | 100.0% | 100.0% |
| Range | 5.6% | 20.8% |
| Mean | 98.3% | 96.5% |
| Median | 98.2% | 98.2% |
| Interquartile 25% (IQ1) | 97.8% | 97.1% |
| Interquartile 75% (IQ3) | 99.0% | 98.6% |
| Interquartile Range (IQR) | 1.2% | 1.5% |
| Standard Deviation (Sample) | 1.1% | 5.1% |
| Standard Deviation (Population) | 1.1% | 5.1% |
Similar Demographics by 3rd Grade
Demographics Similar to Immigrants from South Central Asia by 3rd Grade
In terms of 3rd grade, the demographic groups most similar to Immigrants from South Central Asia are Apache (97.8%, a difference of 0.0%), Soviet Union (97.8%, a difference of 0.010%), Immigrants from North Macedonia (97.8%, a difference of 0.020%), Jordanian (97.8%, a difference of 0.020%), and Immigrants from Eastern Europe (97.8%, a difference of 0.020%).
| Demographics | Rating | Rank | 3rd Grade |
| Immigrants | Greece | 79.5 /100 | #145 | Good 97.9% |
| Alsatians | 78.3 /100 | #146 | Good 97.9% |
| Immigrants | Israel | 77.3 /100 | #147 | Good 97.9% |
| Immigrants | Moldova | 77.1 /100 | #148 | Good 97.9% |
| Immigrants | North Macedonia | 74.5 /100 | #149 | Good 97.8% |
| Jordanians | 74.5 /100 | #150 | Good 97.8% |
| Soviet Union | 72.6 /100 | #151 | Good 97.8% |
| Immigrants | South Central Asia | 69.5 /100 | #152 | Good 97.8% |
| Apache | 68.5 /100 | #153 | Good 97.8% |
| Immigrants | Eastern Europe | 64.1 /100 | #154 | Good 97.8% |
| Bermudans | 62.6 /100 | #155 | Good 97.8% |
| Immigrants | Russia | 61.7 /100 | #156 | Good 97.8% |
| Immigrants | Italy | 61.2 /100 | #157 | Good 97.8% |
| Venezuelans | 60.9 /100 | #158 | Good 97.8% |
| French American Indians | 60.0 /100 | #159 | Average 97.8% |
Demographics Similar to Houma by 3rd Grade
In terms of 3rd grade, the demographic groups most similar to Houma are Afghan (97.1%, a difference of 0.0%), Immigrants from Philippines (97.2%, a difference of 0.020%), Immigrants from Ghana (97.2%, a difference of 0.020%), Barbadian (97.2%, a difference of 0.020%), and Immigrants from Trinidad and Tobago (97.1%, a difference of 0.020%).
| Demographics | Rating | Rank | 3rd Grade |
| Immigrants | Bolivia | 0.1 /100 | #276 | Tragic 97.2% |
| Trinidadians and Tobagonians | 0.1 /100 | #277 | Tragic 97.2% |
| Immigrants | Western Africa | 0.1 /100 | #278 | Tragic 97.2% |
| Immigrants | Philippines | 0.1 /100 | #279 | Tragic 97.2% |
| Immigrants | Ghana | 0.1 /100 | #280 | Tragic 97.2% |
| Barbadians | 0.1 /100 | #281 | Tragic 97.2% |
| Afghans | 0.1 /100 | #282 | Tragic 97.1% |
| Houma | 0.1 /100 | #283 | Tragic 97.1% |
| Immigrants | Trinidad and Tobago | 0.0 /100 | #284 | Tragic 97.1% |
| Immigrants | Hong Kong | 0.0 /100 | #285 | Tragic 97.1% |
| Immigrants | Barbados | 0.0 /100 | #286 | Tragic 97.1% |
| Immigrants | St. Vincent and the Grenadines | 0.0 /100 | #287 | Tragic 97.1% |
| Immigrants | West Indies | 0.0 /100 | #288 | Tragic 97.1% |
| Immigrants | Thailand | 0.0 /100 | #289 | Tragic 97.1% |
| Immigrants | Portugal | 0.0 /100 | #290 | Tragic 97.0% |