Turkish vs Hungarian 3rd Grade
COMPARE
Turkish
Hungarian
3rd Grade
3rd Grade Comparison
Turks
Hungarians
98.1%
3RD GRADE
97.6/ 100
METRIC RATING
104th/ 347
METRIC RANK
98.3%
3RD GRADE
99.9/ 100
METRIC RATING
44th/ 347
METRIC RANK
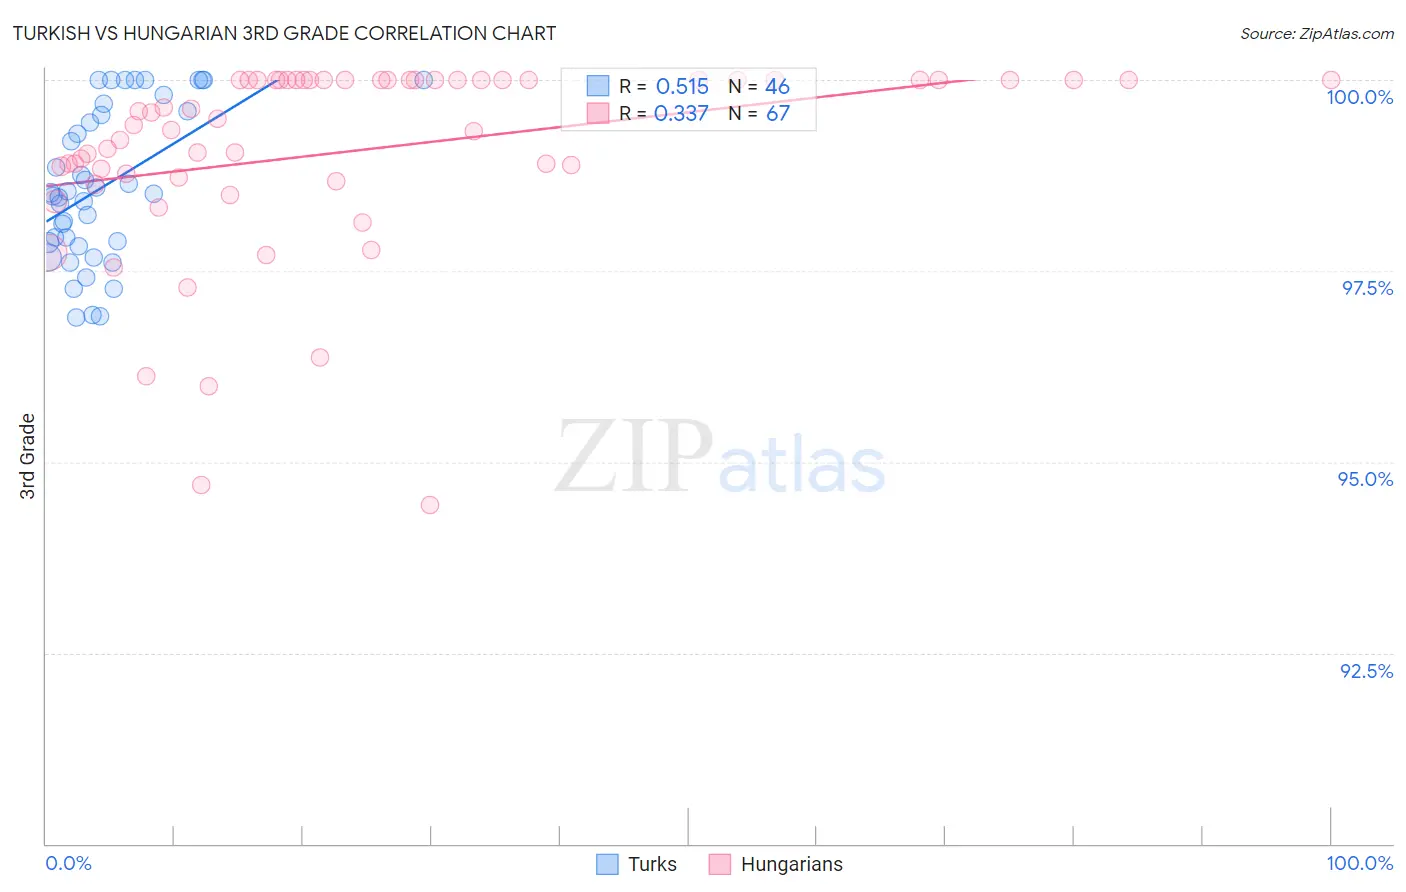
Turkish vs Hungarian 3rd Grade Correlation Chart
The statistical analysis conducted on geographies consisting of 271,858,657 people shows a substantial positive correlation between the proportion of Turks and percentage of population with at least 3rd grade education in the United States with a correlation coefficient (R) of 0.515 and weighted average of 98.1%. Similarly, the statistical analysis conducted on geographies consisting of 486,239,314 people shows a mild positive correlation between the proportion of Hungarians and percentage of population with at least 3rd grade education in the United States with a correlation coefficient (R) of 0.337 and weighted average of 98.3%, a difference of 0.26%.
3rd Grade Correlation Summary
| Measurement | Turkish | Hungarian |
| Minimum | 96.9% | 94.4% |
| Maximum | 100.0% | 100.0% |
| Range | 3.1% | 5.6% |
| Mean | 98.6% | 99.1% |
| Median | 98.5% | 99.5% |
| Interquartile 25% (IQ1) | 97.9% | 98.7% |
| Interquartile 75% (IQ3) | 99.6% | 100.0% |
| Interquartile Range (IQR) | 1.7% | 1.3% |
| Standard Deviation (Sample) | 0.99% | 1.3% |
| Standard Deviation (Population) | 0.98% | 1.3% |
Similar Demographics by 3rd Grade
Demographics Similar to Turks by 3rd Grade
In terms of 3rd grade, the demographic groups most similar to Turks are Yugoslavian (98.1%, a difference of 0.0%), Romanian (98.1%, a difference of 0.010%), Cree (98.1%, a difference of 0.010%), Puget Sound Salish (98.1%, a difference of 0.010%), and Nonimmigrants (98.1%, a difference of 0.010%).
| Demographics | Rating | Rank | 3rd Grade |
| South Africans | 98.2 /100 | #97 | Exceptional 98.1% |
| Choctaw | 98.0 /100 | #98 | Exceptional 98.1% |
| Romanians | 98.0 /100 | #99 | Exceptional 98.1% |
| Cree | 97.9 /100 | #100 | Exceptional 98.1% |
| Puget Sound Salish | 97.9 /100 | #101 | Exceptional 98.1% |
| Immigrants | Nonimmigrants | 97.8 /100 | #102 | Exceptional 98.1% |
| Yugoslavians | 97.7 /100 | #103 | Exceptional 98.1% |
| Turks | 97.6 /100 | #104 | Exceptional 98.1% |
| German Russians | 97.2 /100 | #105 | Exceptional 98.1% |
| Bhutanese | 97.2 /100 | #106 | Exceptional 98.1% |
| Immigrants | Czechoslovakia | 97.0 /100 | #107 | Exceptional 98.0% |
| Immigrants | Singapore | 96.7 /100 | #108 | Exceptional 98.0% |
| Pima | 96.7 /100 | #109 | Exceptional 98.0% |
| Immigrants | Switzerland | 96.6 /100 | #110 | Exceptional 98.0% |
| Basques | 96.5 /100 | #111 | Exceptional 98.0% |
Demographics Similar to Hungarians by 3rd Grade
In terms of 3rd grade, the demographic groups most similar to Hungarians are Native Hawaiian (98.3%, a difference of 0.0%), Northern European (98.3%, a difference of 0.010%), Luxembourger (98.3%, a difference of 0.020%), Belgian (98.3%, a difference of 0.020%), and Eastern European (98.3%, a difference of 0.030%).
| Demographics | Rating | Rank | 3rd Grade |
| Italians | 99.9 /100 | #37 | Exceptional 98.4% |
| Chippewa | 99.9 /100 | #38 | Exceptional 98.4% |
| Latvians | 99.9 /100 | #39 | Exceptional 98.4% |
| Eastern Europeans | 99.9 /100 | #40 | Exceptional 98.3% |
| Luxembourgers | 99.9 /100 | #41 | Exceptional 98.3% |
| Belgians | 99.9 /100 | #42 | Exceptional 98.3% |
| Northern Europeans | 99.9 /100 | #43 | Exceptional 98.3% |
| Hungarians | 99.9 /100 | #44 | Exceptional 98.3% |
| Native Hawaiians | 99.9 /100 | #45 | Exceptional 98.3% |
| Ottawa | 99.8 /100 | #46 | Exceptional 98.3% |
| Czechoslovakians | 99.8 /100 | #47 | Exceptional 98.3% |
| Lumbee | 99.8 /100 | #48 | Exceptional 98.3% |
| Estonians | 99.8 /100 | #49 | Exceptional 98.3% |
| Celtics | 99.8 /100 | #50 | Exceptional 98.3% |
| Australians | 99.8 /100 | #51 | Exceptional 98.3% |