Immigrants from South Central Asia vs Immigrants from Bahamas 5th Grade
COMPARE
Immigrants from South Central Asia
Immigrants from Bahamas
5th Grade
5th Grade Comparison
Immigrants from South Central Asia
Immigrants from Bahamas
97.5%
5TH GRADE
78.6/ 100
METRIC RATING
150th/ 347
METRIC RANK
97.2%
5TH GRADE
14.9/ 100
METRIC RATING
203rd/ 347
METRIC RANK
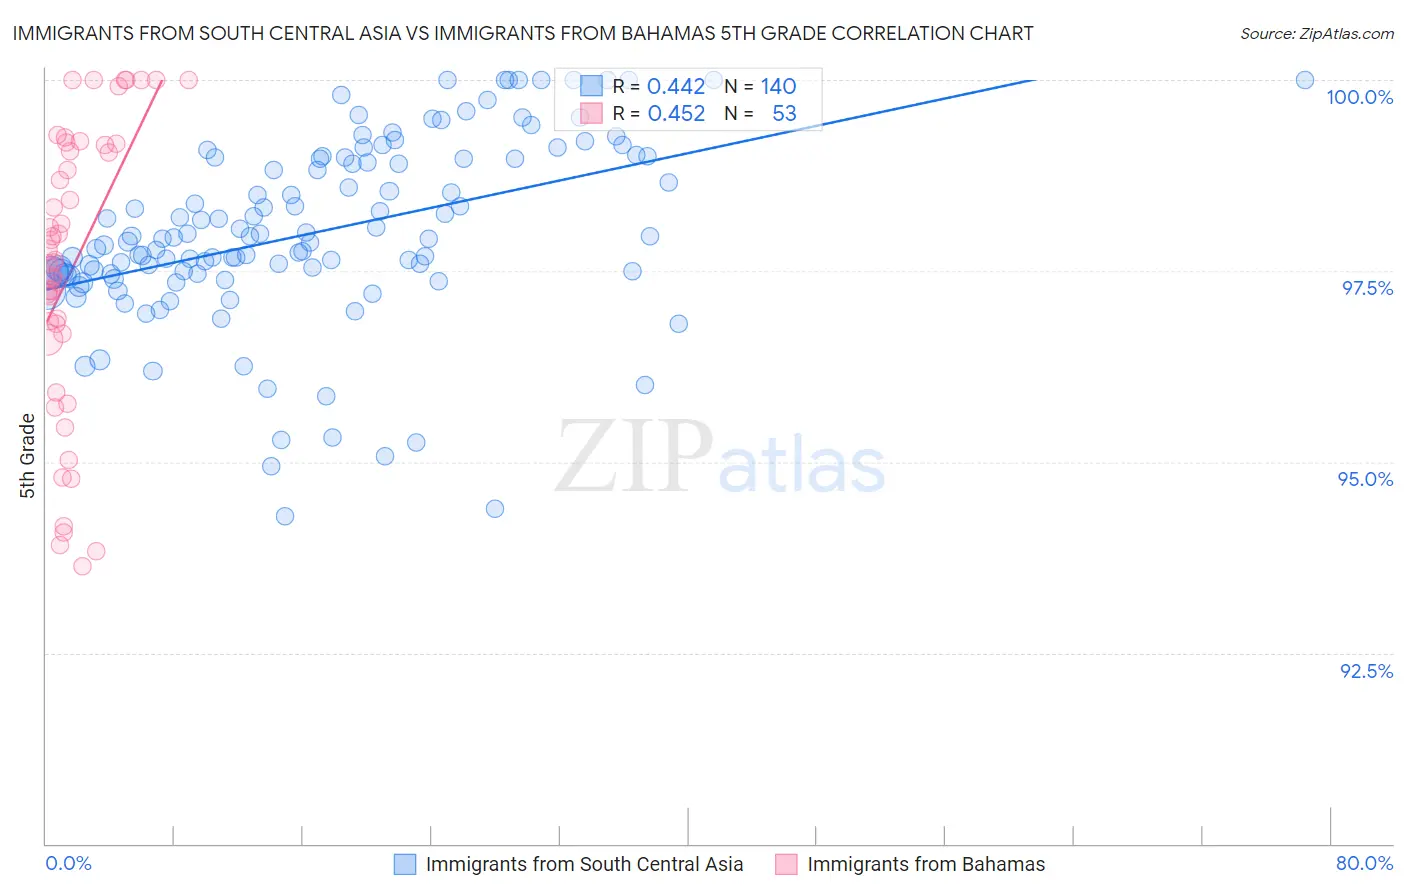
Immigrants from South Central Asia vs Immigrants from Bahamas 5th Grade Correlation Chart
The statistical analysis conducted on geographies consisting of 473,113,181 people shows a moderate positive correlation between the proportion of Immigrants from South Central Asia and percentage of population with at least 5th grade education in the United States with a correlation coefficient (R) of 0.442 and weighted average of 97.5%. Similarly, the statistical analysis conducted on geographies consisting of 104,665,087 people shows a moderate positive correlation between the proportion of Immigrants from Bahamas and percentage of population with at least 5th grade education in the United States with a correlation coefficient (R) of 0.452 and weighted average of 97.2%, a difference of 0.32%.
5th Grade Correlation Summary
| Measurement | Immigrants from South Central Asia | Immigrants from Bahamas |
| Minimum | 94.3% | 93.6% |
| Maximum | 100.0% | 100.0% |
| Range | 5.7% | 6.4% |
| Mean | 98.0% | 97.5% |
| Median | 97.9% | 97.7% |
| Interquartile 25% (IQ1) | 97.5% | 96.6% |
| Interquartile 75% (IQ3) | 99.0% | 99.2% |
| Interquartile Range (IQR) | 1.5% | 2.5% |
| Standard Deviation (Sample) | 1.2% | 1.9% |
| Standard Deviation (Population) | 1.2% | 1.8% |
Similar Demographics by 5th Grade
Demographics Similar to Immigrants from South Central Asia by 5th Grade
In terms of 5th grade, the demographic groups most similar to Immigrants from South Central Asia are Immigrants from Israel (97.5%, a difference of 0.0%), Hopi (97.5%, a difference of 0.0%), Spaniard (97.5%, a difference of 0.020%), Soviet Union (97.5%, a difference of 0.020%), and Immigrants from Eastern Europe (97.4%, a difference of 0.020%).
| Demographics | Rating | Rank | 5th Grade |
| Immigrants | North Macedonia | 85.4 /100 | #143 | Excellent 97.5% |
| Immigrants | Greece | 83.2 /100 | #144 | Excellent 97.5% |
| Jordanians | 82.6 /100 | #145 | Excellent 97.5% |
| Spaniards | 81.9 /100 | #146 | Excellent 97.5% |
| Soviet Union | 81.2 /100 | #147 | Excellent 97.5% |
| Immigrants | Israel | 79.1 /100 | #148 | Good 97.5% |
| Hopi | 78.6 /100 | #149 | Good 97.5% |
| Immigrants | South Central Asia | 78.6 /100 | #150 | Good 97.5% |
| Immigrants | Eastern Europe | 75.0 /100 | #151 | Good 97.4% |
| Ute | 74.9 /100 | #152 | Good 97.4% |
| Alsatians | 74.3 /100 | #153 | Good 97.4% |
| Immigrants | Russia | 71.2 /100 | #154 | Good 97.4% |
| Immigrants | Bosnia and Herzegovina | 71.0 /100 | #155 | Good 97.4% |
| French American Indians | 70.5 /100 | #156 | Good 97.4% |
| Immigrants | Jordan | 70.4 /100 | #157 | Good 97.4% |
Demographics Similar to Immigrants from Bahamas by 5th Grade
In terms of 5th grade, the demographic groups most similar to Immigrants from Bahamas are African (97.2%, a difference of 0.0%), Immigrants from Northern Africa (97.2%, a difference of 0.010%), Immigrants from Chile (97.2%, a difference of 0.010%), Immigrants from Zaire (97.1%, a difference of 0.010%), and Native/Alaskan (97.2%, a difference of 0.020%).
| Demographics | Rating | Rank | 5th Grade |
| Hawaiians | 25.6 /100 | #196 | Fair 97.2% |
| Brazilians | 25.4 /100 | #197 | Fair 97.2% |
| Immigrants | Uganda | 21.1 /100 | #198 | Fair 97.2% |
| Natives/Alaskans | 18.0 /100 | #199 | Poor 97.2% |
| Immigrants | Northern Africa | 16.8 /100 | #200 | Poor 97.2% |
| Immigrants | Chile | 16.6 /100 | #201 | Poor 97.2% |
| Africans | 15.3 /100 | #202 | Poor 97.2% |
| Immigrants | Bahamas | 14.9 /100 | #203 | Poor 97.2% |
| Immigrants | Zaire | 13.7 /100 | #204 | Poor 97.1% |
| Moroccans | 12.0 /100 | #205 | Poor 97.1% |
| Paiute | 11.6 /100 | #206 | Poor 97.1% |
| Iraqis | 10.9 /100 | #207 | Poor 97.1% |
| Laotians | 10.8 /100 | #208 | Poor 97.1% |
| Immigrants | Nepal | 10.3 /100 | #209 | Poor 97.1% |
| Immigrants | Oceania | 10.0 /100 | #210 | Poor 97.1% |