Trinidadian and Tobagonian vs Immigrants from Albania Kindergarten
COMPARE
Trinidadian and Tobagonian
Immigrants from Albania
Kindergarten
Kindergarten Comparison
Trinidadians and Tobagonians
Immigrants from Albania
97.4%
KINDERGARTEN
0.1/ 100
METRIC RATING
281st/ 347
METRIC RANK
97.8%
KINDERGARTEN
16.4/ 100
METRIC RATING
206th/ 347
METRIC RANK
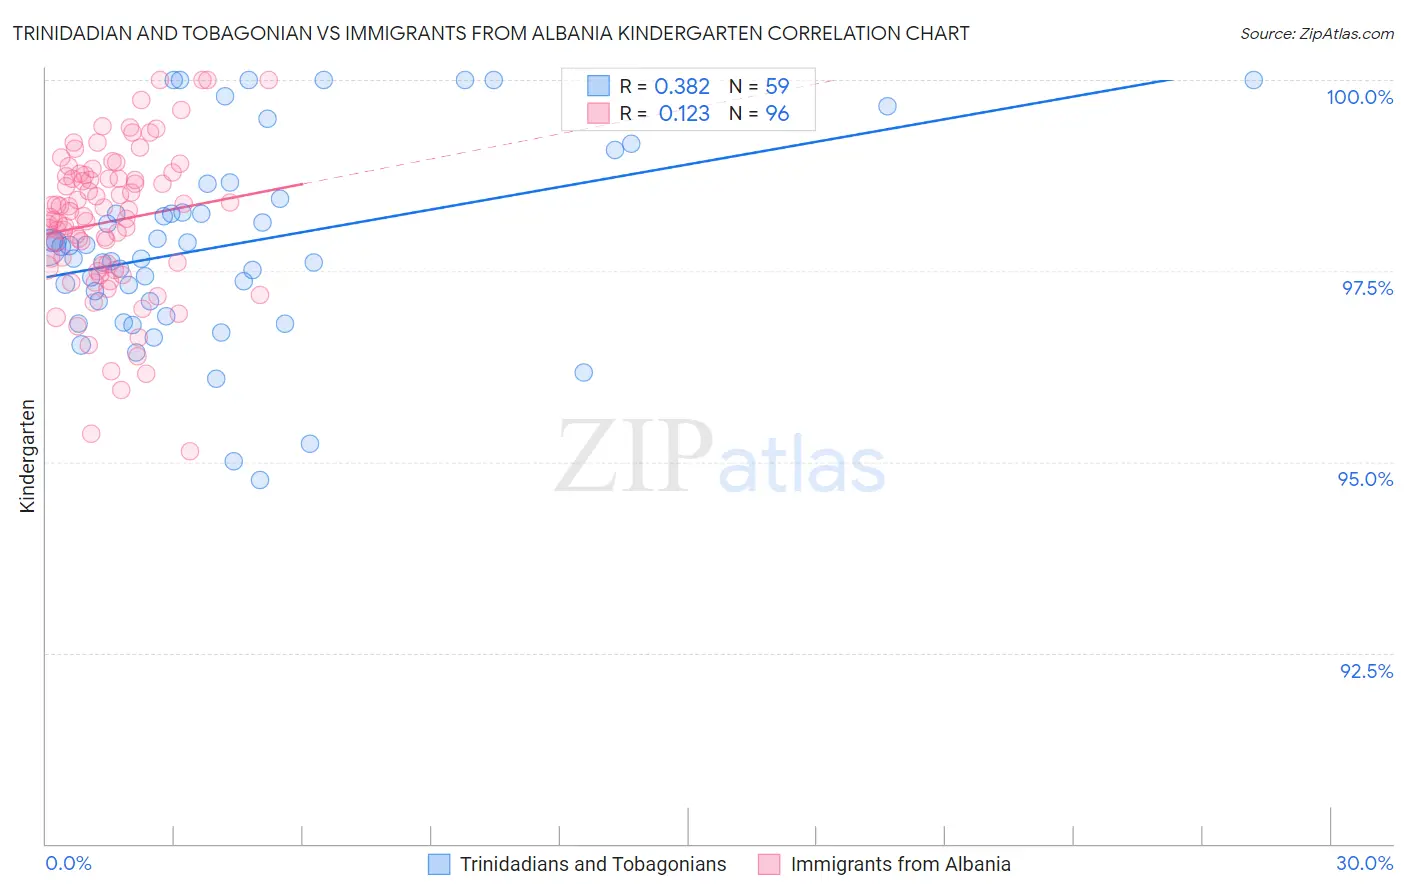
Trinidadian and Tobagonian vs Immigrants from Albania Kindergarten Correlation Chart
The statistical analysis conducted on geographies consisting of 219,882,819 people shows a mild positive correlation between the proportion of Trinidadians and Tobagonians and percentage of population with at least kindergarten education in the United States with a correlation coefficient (R) of 0.382 and weighted average of 97.4%. Similarly, the statistical analysis conducted on geographies consisting of 119,263,578 people shows a poor positive correlation between the proportion of Immigrants from Albania and percentage of population with at least kindergarten education in the United States with a correlation coefficient (R) of 0.123 and weighted average of 97.8%, a difference of 0.46%.
Kindergarten Correlation Summary
| Measurement | Trinidadian and Tobagonian | Immigrants from Albania |
| Minimum | 94.8% | 95.1% |
| Maximum | 100.0% | 100.0% |
| Range | 5.2% | 4.9% |
| Mean | 97.8% | 98.1% |
| Median | 97.8% | 98.3% |
| Interquartile 25% (IQ1) | 97.1% | 97.6% |
| Interquartile 75% (IQ3) | 98.4% | 98.7% |
| Interquartile Range (IQR) | 1.3% | 1.2% |
| Standard Deviation (Sample) | 1.3% | 0.98% |
| Standard Deviation (Population) | 1.3% | 0.98% |
Similar Demographics by Kindergarten
Demographics Similar to Trinidadians and Tobagonians by Kindergarten
In terms of kindergarten, the demographic groups most similar to Trinidadians and Tobagonians are Barbadian (97.4%, a difference of 0.0%), Immigrants from Uzbekistan (97.4%, a difference of 0.010%), Immigrants from Ghana (97.4%, a difference of 0.010%), Afghan (97.4%, a difference of 0.010%), and Immigrants from Western Africa (97.4%, a difference of 0.030%).
| Demographics | Rating | Rank | Kindergarten |
| Immigrants | Cameroon | 0.1 /100 | #274 | Tragic 97.4% |
| Ghanaians | 0.1 /100 | #275 | Tragic 97.4% |
| Immigrants | Philippines | 0.1 /100 | #276 | Tragic 97.4% |
| Immigrants | Western Africa | 0.1 /100 | #277 | Tragic 97.4% |
| Immigrants | Uzbekistan | 0.1 /100 | #278 | Tragic 97.4% |
| Immigrants | Ghana | 0.1 /100 | #279 | Tragic 97.4% |
| Barbadians | 0.1 /100 | #280 | Tragic 97.4% |
| Trinidadians and Tobagonians | 0.1 /100 | #281 | Tragic 97.4% |
| Afghans | 0.0 /100 | #282 | Tragic 97.4% |
| Immigrants | West Indies | 0.0 /100 | #283 | Tragic 97.3% |
| Immigrants | Trinidad and Tobago | 0.0 /100 | #284 | Tragic 97.3% |
| Immigrants | Portugal | 0.0 /100 | #285 | Tragic 97.3% |
| Immigrants | Barbados | 0.0 /100 | #286 | Tragic 97.3% |
| Immigrants | Hong Kong | 0.0 /100 | #287 | Tragic 97.3% |
| Immigrants | Thailand | 0.0 /100 | #288 | Tragic 97.3% |
Demographics Similar to Immigrants from Albania by Kindergarten
In terms of kindergarten, the demographic groups most similar to Immigrants from Albania are African (97.8%, a difference of 0.0%), Immigrants from Ukraine (97.8%, a difference of 0.010%), Immigrants from Uganda (97.8%, a difference of 0.010%), Immigrants from Chile (97.8%, a difference of 0.010%), and Immigrants from Southern Europe (97.8%, a difference of 0.010%).
| Demographics | Rating | Rank | Kindergarten |
| Immigrants | Egypt | 22.3 /100 | #199 | Fair 97.9% |
| Yuman | 21.6 /100 | #200 | Fair 97.9% |
| Immigrants | Lebanon | 20.9 /100 | #201 | Fair 97.9% |
| Immigrants | Ukraine | 19.1 /100 | #202 | Poor 97.8% |
| Immigrants | Uganda | 18.8 /100 | #203 | Poor 97.8% |
| Immigrants | Chile | 18.1 /100 | #204 | Poor 97.8% |
| Immigrants | Southern Europe | 18.0 /100 | #205 | Poor 97.8% |
| Immigrants | Albania | 16.4 /100 | #206 | Poor 97.8% |
| Africans | 16.1 /100 | #207 | Poor 97.8% |
| Immigrants | Northern Africa | 12.0 /100 | #208 | Poor 97.8% |
| Costa Ricans | 11.6 /100 | #209 | Poor 97.8% |
| Immigrants | Oceania | 11.1 /100 | #210 | Poor 97.8% |
| Laotians | 10.5 /100 | #211 | Poor 97.8% |
| Moroccans | 8.9 /100 | #212 | Tragic 97.8% |
| South American Indians | 7.7 /100 | #213 | Tragic 97.8% |