Tongan vs Immigrants from Kuwait 11th Grade
COMPARE
Tongan
Immigrants from Kuwait
11th Grade
11th Grade Comparison
Tongans
Immigrants from Kuwait
92.2%
11TH GRADE
19.8/ 100
METRIC RATING
209th/ 347
METRIC RANK
93.5%
11TH GRADE
98.4/ 100
METRIC RATING
109th/ 347
METRIC RANK
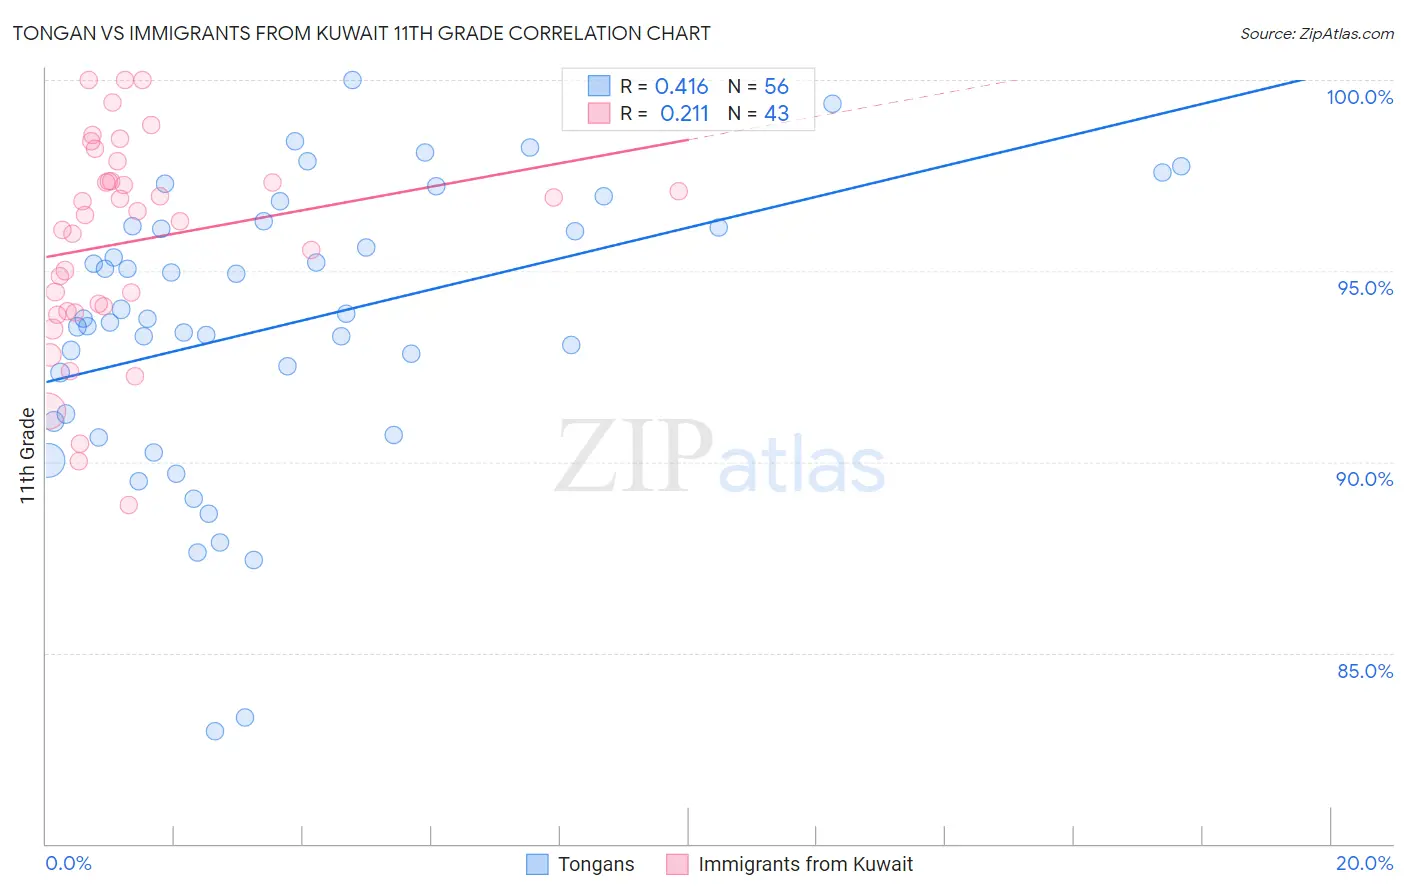
Tongan vs Immigrants from Kuwait 11th Grade Correlation Chart
The statistical analysis conducted on geographies consisting of 102,873,790 people shows a moderate positive correlation between the proportion of Tongans and percentage of population with at least 11th grade education in the United States with a correlation coefficient (R) of 0.416 and weighted average of 92.2%. Similarly, the statistical analysis conducted on geographies consisting of 136,917,085 people shows a weak positive correlation between the proportion of Immigrants from Kuwait and percentage of population with at least 11th grade education in the United States with a correlation coefficient (R) of 0.211 and weighted average of 93.5%, a difference of 1.4%.
11th Grade Correlation Summary
| Measurement | Tongan | Immigrants from Kuwait |
| Minimum | 82.9% | 88.9% |
| Maximum | 100.0% | 100.0% |
| Range | 17.1% | 11.1% |
| Mean | 93.6% | 95.8% |
| Median | 93.8% | 96.5% |
| Interquartile 25% (IQ1) | 91.2% | 94.0% |
| Interquartile 75% (IQ3) | 96.2% | 97.4% |
| Interquartile Range (IQR) | 5.0% | 3.4% |
| Standard Deviation (Sample) | 3.7% | 2.7% |
| Standard Deviation (Population) | 3.7% | 2.7% |
Similar Demographics by 11th Grade
Demographics Similar to Tongans by 11th Grade
In terms of 11th grade, the demographic groups most similar to Tongans are Ethiopian (92.2%, a difference of 0.010%), Colville (92.2%, a difference of 0.030%), Immigrants from Micronesia (92.2%, a difference of 0.030%), Immigrants from Oceania (92.2%, a difference of 0.040%), and Immigrants from Sudan (92.3%, a difference of 0.050%).
| Demographics | Rating | Rank | 11th Grade |
| Immigrants | Eastern Africa | 24.1 /100 | #202 | Fair 92.3% |
| Immigrants | Sudan | 23.5 /100 | #203 | Fair 92.3% |
| Immigrants | Hong Kong | 23.3 /100 | #204 | Fair 92.2% |
| Kiowa | 23.2 /100 | #205 | Fair 92.2% |
| Bolivians | 23.2 /100 | #206 | Fair 92.2% |
| Immigrants | Oceania | 22.4 /100 | #207 | Fair 92.2% |
| Colville | 21.8 /100 | #208 | Fair 92.2% |
| Tongans | 19.8 /100 | #209 | Poor 92.2% |
| Ethiopians | 18.8 /100 | #210 | Poor 92.2% |
| Immigrants | Micronesia | 17.7 /100 | #211 | Poor 92.2% |
| Koreans | 14.4 /100 | #212 | Poor 92.1% |
| Immigrants | Ethiopia | 13.9 /100 | #213 | Poor 92.1% |
| Afghans | 12.8 /100 | #214 | Poor 92.1% |
| Immigrants | Southern Europe | 12.5 /100 | #215 | Poor 92.1% |
| Somalis | 11.6 /100 | #216 | Poor 92.1% |
Demographics Similar to Immigrants from Kuwait by 11th Grade
In terms of 11th grade, the demographic groups most similar to Immigrants from Kuwait are Alaska Native (93.5%, a difference of 0.0%), Immigrants from Norway (93.5%, a difference of 0.010%), Syrian (93.4%, a difference of 0.010%), Chippewa (93.5%, a difference of 0.030%), and Lebanese (93.5%, a difference of 0.030%).
| Demographics | Rating | Rank | 11th Grade |
| Chippewa | 98.6 /100 | #102 | Exceptional 93.5% |
| Lebanese | 98.6 /100 | #103 | Exceptional 93.5% |
| Immigrants | Europe | 98.6 /100 | #104 | Exceptional 93.5% |
| Immigrants | Serbia | 98.6 /100 | #105 | Exceptional 93.5% |
| Immigrants | Croatia | 98.6 /100 | #106 | Exceptional 93.5% |
| Immigrants | Norway | 98.4 /100 | #107 | Exceptional 93.5% |
| Alaska Natives | 98.4 /100 | #108 | Exceptional 93.5% |
| Immigrants | Kuwait | 98.4 /100 | #109 | Exceptional 93.5% |
| Syrians | 98.4 /100 | #110 | Exceptional 93.4% |
| Yugoslavians | 98.1 /100 | #111 | Exceptional 93.4% |
| Immigrants | Germany | 98.0 /100 | #112 | Exceptional 93.4% |
| Immigrants | Zimbabwe | 97.8 /100 | #113 | Exceptional 93.4% |
| Jordanians | 97.8 /100 | #114 | Exceptional 93.4% |
| Palestinians | 97.7 /100 | #115 | Exceptional 93.4% |
| Immigrants | Hungary | 97.5 /100 | #116 | Exceptional 93.4% |