Chickasaw vs Immigrants from Kuwait 11th Grade
COMPARE
Chickasaw
Immigrants from Kuwait
11th Grade
11th Grade Comparison
Chickasaw
Immigrants from Kuwait
92.3%
11TH GRADE
31.4/ 100
METRIC RATING
190th/ 347
METRIC RANK
93.5%
11TH GRADE
98.4/ 100
METRIC RATING
109th/ 347
METRIC RANK
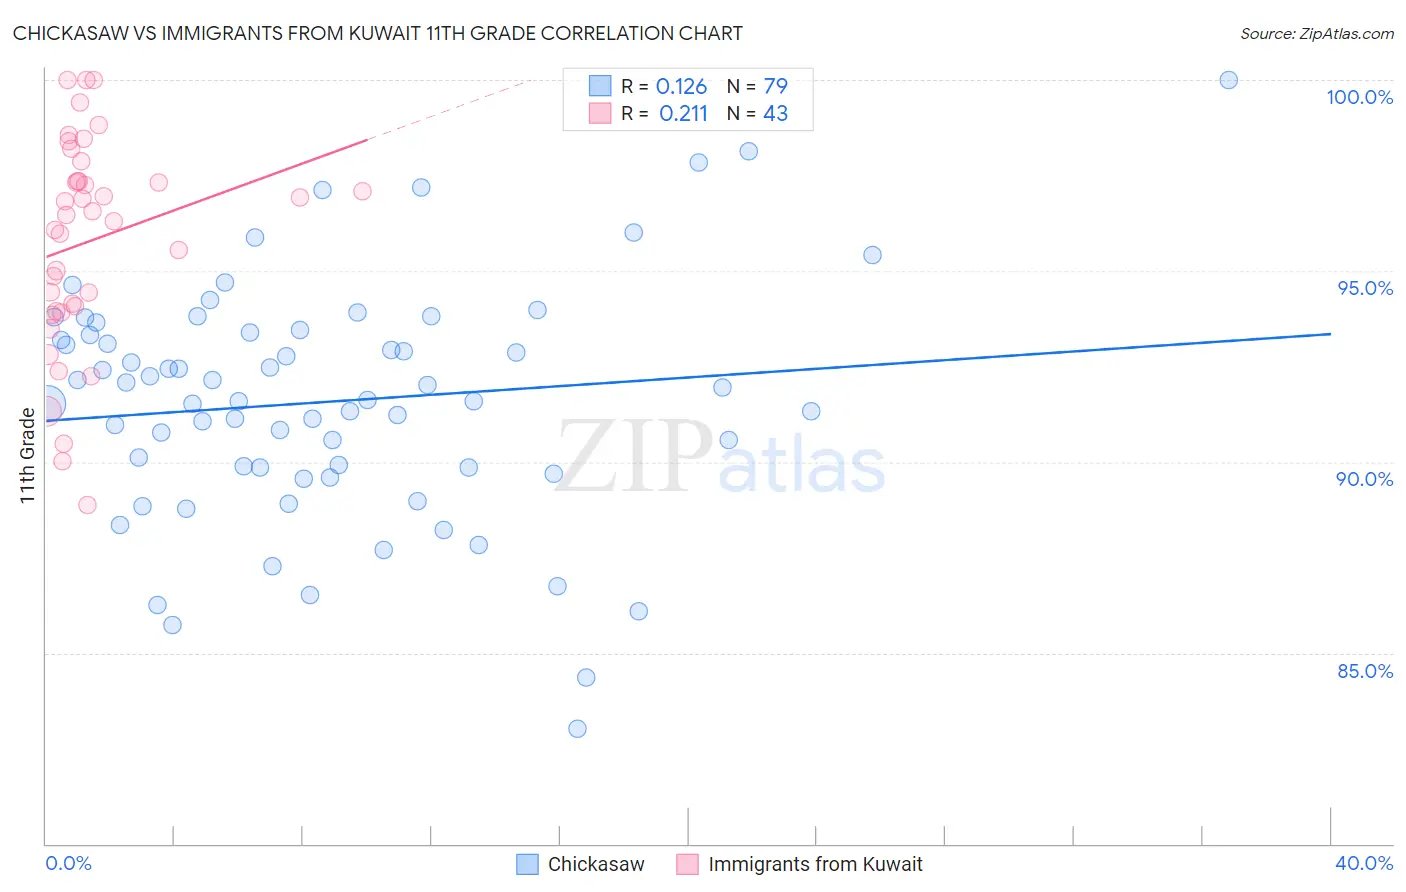
Chickasaw vs Immigrants from Kuwait 11th Grade Correlation Chart
The statistical analysis conducted on geographies consisting of 147,726,791 people shows a poor positive correlation between the proportion of Chickasaw and percentage of population with at least 11th grade education in the United States with a correlation coefficient (R) of 0.126 and weighted average of 92.3%. Similarly, the statistical analysis conducted on geographies consisting of 136,917,085 people shows a weak positive correlation between the proportion of Immigrants from Kuwait and percentage of population with at least 11th grade education in the United States with a correlation coefficient (R) of 0.211 and weighted average of 93.5%, a difference of 1.2%.
11th Grade Correlation Summary
| Measurement | Chickasaw | Immigrants from Kuwait |
| Minimum | 83.0% | 88.9% |
| Maximum | 100.0% | 100.0% |
| Range | 17.0% | 11.1% |
| Mean | 91.6% | 95.8% |
| Median | 91.6% | 96.5% |
| Interquartile 25% (IQ1) | 89.8% | 94.0% |
| Interquartile 75% (IQ3) | 93.4% | 97.4% |
| Interquartile Range (IQR) | 3.5% | 3.4% |
| Standard Deviation (Sample) | 3.1% | 2.7% |
| Standard Deviation (Population) | 3.1% | 2.7% |
Similar Demographics by 11th Grade
Demographics Similar to Chickasaw by 11th Grade
In terms of 11th grade, the demographic groups most similar to Chickasaw are French American Indian (92.3%, a difference of 0.010%), Immigrants from Syria (92.3%, a difference of 0.010%), Immigrants from Chile (92.4%, a difference of 0.020%), Immigrants from Indonesia (92.4%, a difference of 0.030%), and Moroccan (92.3%, a difference of 0.030%).
| Demographics | Rating | Rank | 11th Grade |
| Immigrants | Malaysia | 37.6 /100 | #183 | Fair 92.4% |
| Immigrants | Asia | 37.4 /100 | #184 | Fair 92.4% |
| Immigrants | Nepal | 36.4 /100 | #185 | Fair 92.4% |
| Arapaho | 35.1 /100 | #186 | Fair 92.4% |
| Immigrants | Western Asia | 35.0 /100 | #187 | Fair 92.4% |
| Immigrants | Indonesia | 33.7 /100 | #188 | Fair 92.4% |
| Immigrants | Chile | 33.3 /100 | #189 | Fair 92.4% |
| Chickasaw | 31.4 /100 | #190 | Fair 92.3% |
| French American Indians | 30.8 /100 | #191 | Fair 92.3% |
| Immigrants | Syria | 30.4 /100 | #192 | Fair 92.3% |
| Moroccans | 28.7 /100 | #193 | Fair 92.3% |
| Sioux | 28.5 /100 | #194 | Fair 92.3% |
| Liberians | 26.8 /100 | #195 | Fair 92.3% |
| Panamanians | 26.4 /100 | #196 | Fair 92.3% |
| Marshallese | 26.0 /100 | #197 | Fair 92.3% |
Demographics Similar to Immigrants from Kuwait by 11th Grade
In terms of 11th grade, the demographic groups most similar to Immigrants from Kuwait are Alaska Native (93.5%, a difference of 0.0%), Immigrants from Norway (93.5%, a difference of 0.010%), Syrian (93.4%, a difference of 0.010%), Chippewa (93.5%, a difference of 0.030%), and Lebanese (93.5%, a difference of 0.030%).
| Demographics | Rating | Rank | 11th Grade |
| Chippewa | 98.6 /100 | #102 | Exceptional 93.5% |
| Lebanese | 98.6 /100 | #103 | Exceptional 93.5% |
| Immigrants | Europe | 98.6 /100 | #104 | Exceptional 93.5% |
| Immigrants | Serbia | 98.6 /100 | #105 | Exceptional 93.5% |
| Immigrants | Croatia | 98.6 /100 | #106 | Exceptional 93.5% |
| Immigrants | Norway | 98.4 /100 | #107 | Exceptional 93.5% |
| Alaska Natives | 98.4 /100 | #108 | Exceptional 93.5% |
| Immigrants | Kuwait | 98.4 /100 | #109 | Exceptional 93.5% |
| Syrians | 98.4 /100 | #110 | Exceptional 93.4% |
| Yugoslavians | 98.1 /100 | #111 | Exceptional 93.4% |
| Immigrants | Germany | 98.0 /100 | #112 | Exceptional 93.4% |
| Immigrants | Zimbabwe | 97.8 /100 | #113 | Exceptional 93.4% |
| Jordanians | 97.8 /100 | #114 | Exceptional 93.4% |
| Palestinians | 97.7 /100 | #115 | Exceptional 93.4% |
| Immigrants | Hungary | 97.5 /100 | #116 | Exceptional 93.4% |