Immigrants from Canada vs Guamanian/Chamorro 7th Grade
COMPARE
Immigrants from Canada
Guamanian/Chamorro
7th Grade
7th Grade Comparison
Immigrants from Canada
Guamanians/Chamorros
96.9%
7TH GRADE
99.8/ 100
METRIC RATING
60th/ 347
METRIC RANK
95.9%
7TH GRADE
23.5/ 100
METRIC RATING
199th/ 347
METRIC RANK
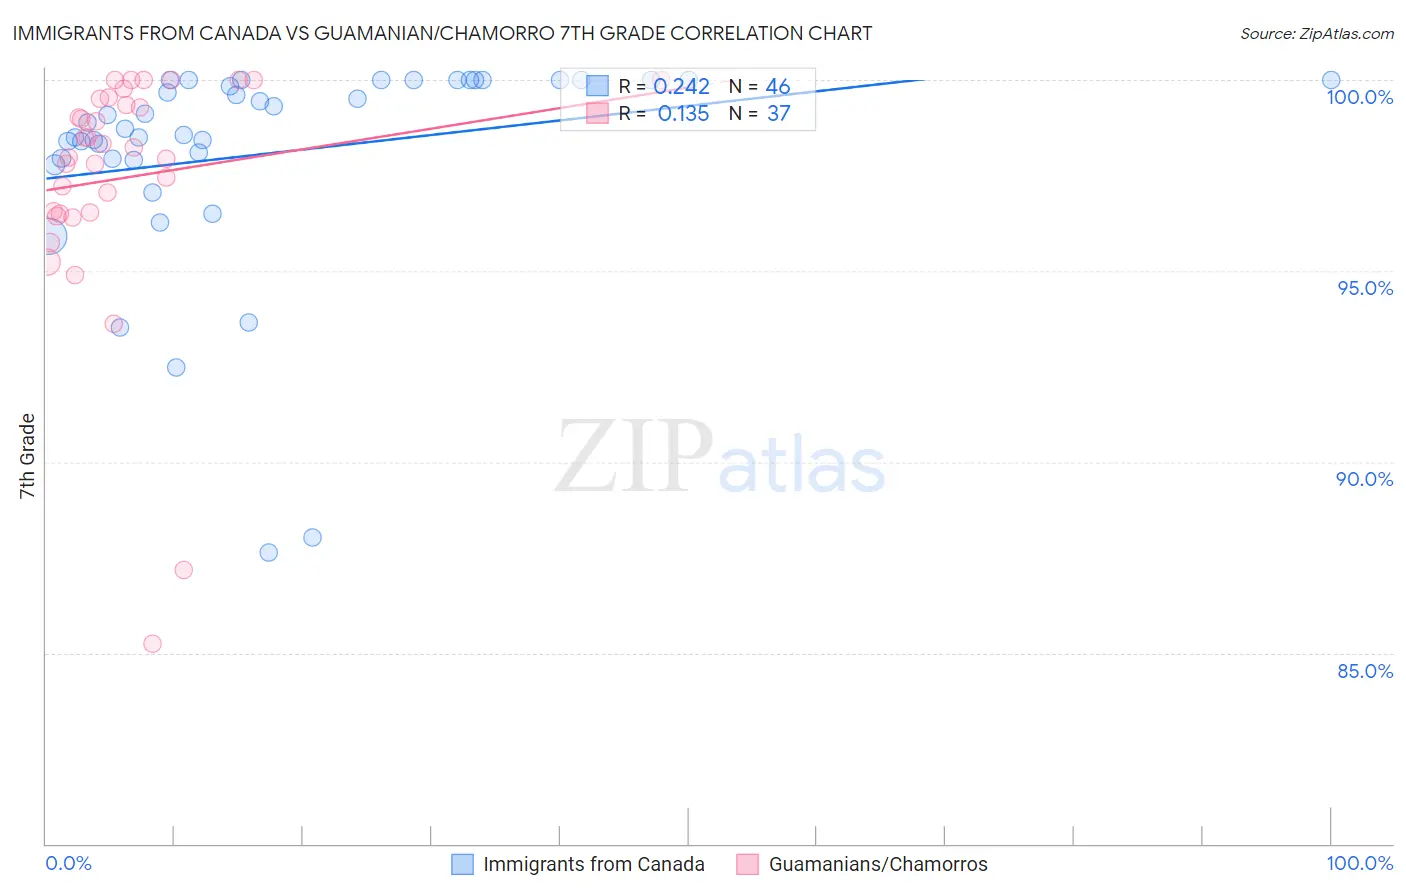
Immigrants from Canada vs Guamanian/Chamorro 7th Grade Correlation Chart
The statistical analysis conducted on geographies consisting of 459,397,484 people shows a weak positive correlation between the proportion of Immigrants from Canada and percentage of population with at least 7th grade education in the United States with a correlation coefficient (R) of 0.242 and weighted average of 96.9%. Similarly, the statistical analysis conducted on geographies consisting of 221,965,618 people shows a poor positive correlation between the proportion of Guamanians/Chamorros and percentage of population with at least 7th grade education in the United States with a correlation coefficient (R) of 0.135 and weighted average of 95.9%, a difference of 1.1%.
7th Grade Correlation Summary
| Measurement | Immigrants from Canada | Guamanian/Chamorro |
| Minimum | 87.6% | 85.2% |
| Maximum | 100.0% | 100.0% |
| Range | 12.4% | 14.8% |
| Mean | 98.1% | 97.4% |
| Median | 98.8% | 98.2% |
| Interquartile 25% (IQ1) | 97.9% | 96.5% |
| Interquartile 75% (IQ3) | 100.0% | 99.5% |
| Interquartile Range (IQR) | 2.1% | 3.0% |
| Standard Deviation (Sample) | 2.8% | 3.2% |
| Standard Deviation (Population) | 2.8% | 3.1% |
Similar Demographics by 7th Grade
Demographics Similar to Immigrants from Canada by 7th Grade
In terms of 7th grade, the demographic groups most similar to Immigrants from Canada are Creek (96.9%, a difference of 0.0%), White/Caucasian (97.0%, a difference of 0.010%), Macedonian (97.0%, a difference of 0.010%), Immigrants from North America (96.9%, a difference of 0.010%), and American (97.0%, a difference of 0.020%).
| Demographics | Rating | Rank | 7th Grade |
| Austrians | 99.8 /100 | #53 | Exceptional 97.0% |
| Australians | 99.8 /100 | #54 | Exceptional 97.0% |
| Russians | 99.8 /100 | #55 | Exceptional 97.0% |
| Serbians | 99.8 /100 | #56 | Exceptional 97.0% |
| Americans | 99.8 /100 | #57 | Exceptional 97.0% |
| Whites/Caucasians | 99.8 /100 | #58 | Exceptional 97.0% |
| Macedonians | 99.8 /100 | #59 | Exceptional 97.0% |
| Immigrants | Canada | 99.8 /100 | #60 | Exceptional 96.9% |
| Creek | 99.8 /100 | #61 | Exceptional 96.9% |
| Immigrants | North America | 99.8 /100 | #62 | Exceptional 96.9% |
| Immigrants | Northern Europe | 99.7 /100 | #63 | Exceptional 96.9% |
| Immigrants | Austria | 99.7 /100 | #64 | Exceptional 96.9% |
| Canadians | 99.7 /100 | #65 | Exceptional 96.9% |
| Ukrainians | 99.7 /100 | #66 | Exceptional 96.9% |
| Native Hawaiians | 99.7 /100 | #67 | Exceptional 96.9% |
Demographics Similar to Guamanians/Chamorros by 7th Grade
In terms of 7th grade, the demographic groups most similar to Guamanians/Chamorros are Argentinean (95.9%, a difference of 0.0%), Paraguayan (95.9%, a difference of 0.010%), Immigrants from Argentina (95.9%, a difference of 0.010%), Immigrants from Northern Africa (95.8%, a difference of 0.020%), and Comanche (95.8%, a difference of 0.020%).
| Demographics | Rating | Rank | 7th Grade |
| Panamanians | 32.3 /100 | #192 | Fair 95.9% |
| Immigrants | Bahamas | 30.8 /100 | #193 | Fair 95.9% |
| Immigrants | Nepal | 30.0 /100 | #194 | Fair 95.9% |
| Sudanese | 28.1 /100 | #195 | Fair 95.9% |
| Apache | 27.6 /100 | #196 | Fair 95.9% |
| Immigrants | Zaire | 26.7 /100 | #197 | Fair 95.9% |
| Paraguayans | 24.8 /100 | #198 | Fair 95.9% |
| Guamanians/Chamorros | 23.5 /100 | #199 | Fair 95.9% |
| Argentineans | 23.2 /100 | #200 | Fair 95.9% |
| Immigrants | Argentina | 21.9 /100 | #201 | Fair 95.9% |
| Immigrants | Northern Africa | 21.4 /100 | #202 | Fair 95.8% |
| Comanche | 21.1 /100 | #203 | Fair 95.8% |
| Assyrians/Chaldeans/Syriacs | 20.5 /100 | #204 | Fair 95.8% |
| Moroccans | 18.9 /100 | #205 | Poor 95.8% |
| Africans | 17.6 /100 | #206 | Poor 95.8% |