Tlingit-Haida vs Cajun Kindergarten
COMPARE
Tlingit-Haida
Cajun
Kindergarten
Kindergarten Comparison
Tlingit-Haida
Cajuns
98.7%
KINDERGARTEN
100.0/ 100
METRIC RATING
9th/ 347
METRIC RANK
98.3%
KINDERGARTEN
99.4/ 100
METRIC RATING
73rd/ 347
METRIC RANK
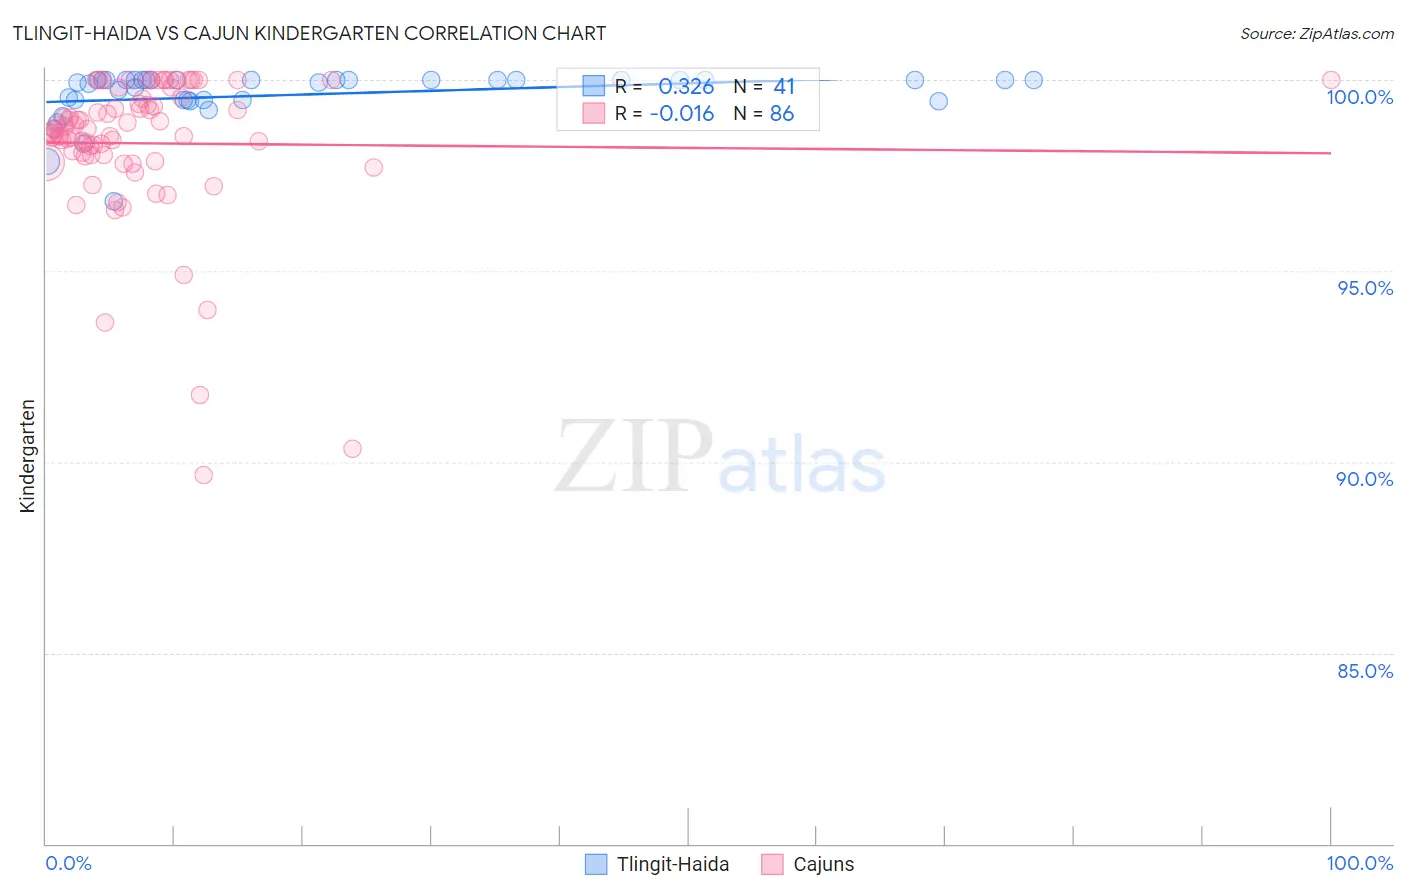
Tlingit-Haida vs Cajun Kindergarten Correlation Chart
The statistical analysis conducted on geographies consisting of 60,865,648 people shows a mild positive correlation between the proportion of Tlingit-Haida and percentage of population with at least kindergarten education in the United States with a correlation coefficient (R) of 0.326 and weighted average of 98.7%. Similarly, the statistical analysis conducted on geographies consisting of 149,712,957 people shows no correlation between the proportion of Cajuns and percentage of population with at least kindergarten education in the United States with a correlation coefficient (R) of -0.016 and weighted average of 98.3%, a difference of 0.38%.
Kindergarten Correlation Summary
| Measurement | Tlingit-Haida | Cajun |
| Minimum | 96.8% | 89.7% |
| Maximum | 100.0% | 100.0% |
| Range | 3.2% | 10.3% |
| Mean | 99.6% | 98.3% |
| Median | 100.0% | 98.7% |
| Interquartile 25% (IQ1) | 99.5% | 98.0% |
| Interquartile 75% (IQ3) | 100.0% | 99.5% |
| Interquartile Range (IQR) | 0.53% | 1.5% |
| Standard Deviation (Sample) | 0.67% | 1.9% |
| Standard Deviation (Population) | 0.66% | 1.9% |
Similar Demographics by Kindergarten
Demographics Similar to Tlingit-Haida by Kindergarten
In terms of kindergarten, the demographic groups most similar to Tlingit-Haida are Slovak (98.7%, a difference of 0.0%), Norwegian (98.7%, a difference of 0.010%), German (98.7%, a difference of 0.010%), Slovene (98.7%, a difference of 0.030%), and Alaska Native (98.7%, a difference of 0.040%).
| Demographics | Rating | Rank | Kindergarten |
| Yup'ik | 100.0 /100 | #2 | Exceptional 99.2% |
| Inupiat | 100.0 /100 | #3 | Exceptional 98.9% |
| Welsh | 100.0 /100 | #4 | Exceptional 98.9% |
| Tsimshian | 100.0 /100 | #5 | Exceptional 98.8% |
| Alaskan Athabascans | 100.0 /100 | #6 | Exceptional 98.8% |
| Alaska Natives | 100.0 /100 | #7 | Exceptional 98.7% |
| Norwegians | 100.0 /100 | #8 | Exceptional 98.7% |
| Tlingit-Haida | 100.0 /100 | #9 | Exceptional 98.7% |
| Slovaks | 100.0 /100 | #10 | Exceptional 98.7% |
| Germans | 100.0 /100 | #11 | Exceptional 98.7% |
| Slovenes | 100.0 /100 | #12 | Exceptional 98.7% |
| Carpatho Rusyns | 100.0 /100 | #13 | Exceptional 98.7% |
| English | 100.0 /100 | #14 | Exceptional 98.7% |
| Swedes | 100.0 /100 | #15 | Exceptional 98.7% |
| Aleuts | 100.0 /100 | #16 | Exceptional 98.6% |
Demographics Similar to Cajuns by Kindergarten
In terms of kindergarten, the demographic groups most similar to Cajuns are Immigrants from Netherlands (98.3%, a difference of 0.010%), Cherokee (98.3%, a difference of 0.010%), Immigrants from England (98.3%, a difference of 0.010%), Delaware (98.3%, a difference of 0.020%), and Shoshone (98.3%, a difference of 0.020%).
| Demographics | Rating | Rank | Kindergarten |
| Cheyenne | 99.6 /100 | #66 | Exceptional 98.4% |
| Canadians | 99.6 /100 | #67 | Exceptional 98.4% |
| Immigrants | Northern Europe | 99.6 /100 | #68 | Exceptional 98.4% |
| Immigrants | Austria | 99.6 /100 | #69 | Exceptional 98.4% |
| Russians | 99.6 /100 | #70 | Exceptional 98.4% |
| Chickasaw | 99.6 /100 | #71 | Exceptional 98.4% |
| Serbians | 99.6 /100 | #72 | Exceptional 98.4% |
| Cajuns | 99.4 /100 | #73 | Exceptional 98.3% |
| Immigrants | Netherlands | 99.3 /100 | #74 | Exceptional 98.3% |
| Cherokee | 99.3 /100 | #75 | Exceptional 98.3% |
| Immigrants | England | 99.3 /100 | #76 | Exceptional 98.3% |
| Delaware | 99.3 /100 | #77 | Exceptional 98.3% |
| Shoshone | 99.2 /100 | #78 | Exceptional 98.3% |
| Immigrants | Belgium | 99.2 /100 | #79 | Exceptional 98.3% |
| Immigrants | Lithuania | 99.2 /100 | #80 | Exceptional 98.3% |