Alsatian vs Cajun Kindergarten
COMPARE
Alsatian
Cajun
Kindergarten
Kindergarten Comparison
Alsatians
Cajuns
98.1%
KINDERGARTEN
80.4/ 100
METRIC RATING
144th/ 347
METRIC RANK
98.3%
KINDERGARTEN
99.4/ 100
METRIC RATING
73rd/ 347
METRIC RANK
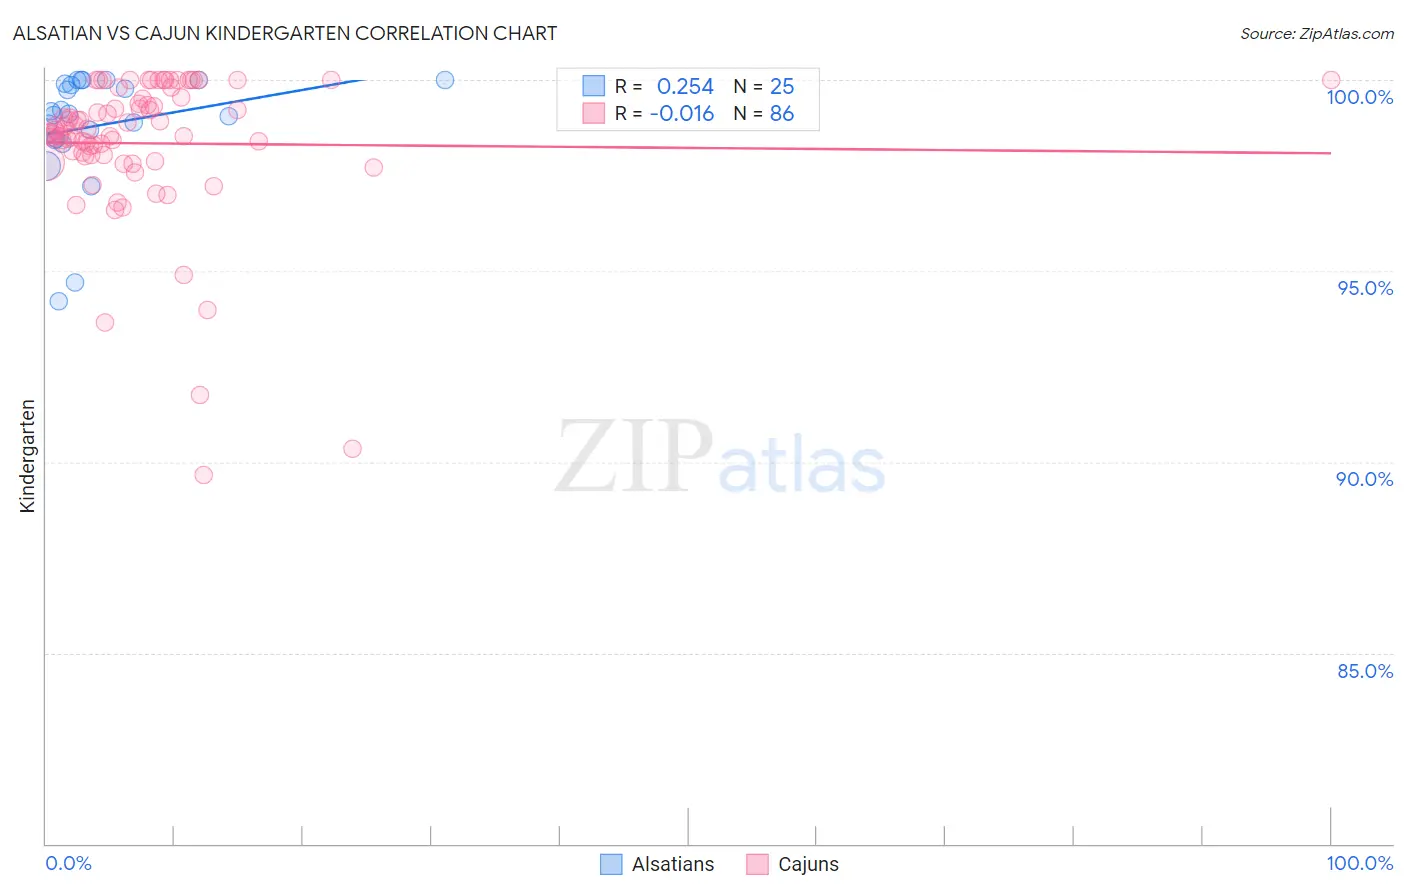
Alsatian vs Cajun Kindergarten Correlation Chart
The statistical analysis conducted on geographies consisting of 82,682,365 people shows a weak positive correlation between the proportion of Alsatians and percentage of population with at least kindergarten education in the United States with a correlation coefficient (R) of 0.254 and weighted average of 98.1%. Similarly, the statistical analysis conducted on geographies consisting of 149,712,957 people shows no correlation between the proportion of Cajuns and percentage of population with at least kindergarten education in the United States with a correlation coefficient (R) of -0.016 and weighted average of 98.3%, a difference of 0.28%.
Kindergarten Correlation Summary
| Measurement | Alsatian | Cajun |
| Minimum | 94.2% | 89.7% |
| Maximum | 100.0% | 100.0% |
| Range | 5.8% | 10.3% |
| Mean | 98.8% | 98.3% |
| Median | 99.1% | 98.7% |
| Interquartile 25% (IQ1) | 98.5% | 98.0% |
| Interquartile 75% (IQ3) | 100.0% | 99.5% |
| Interquartile Range (IQR) | 1.5% | 1.5% |
| Standard Deviation (Sample) | 1.5% | 1.9% |
| Standard Deviation (Population) | 1.5% | 1.9% |
Similar Demographics by Kindergarten
Demographics Similar to Alsatians by Kindergarten
In terms of kindergarten, the demographic groups most similar to Alsatians are Marshallese (98.1%, a difference of 0.010%), Immigrants from Turkey (98.1%, a difference of 0.010%), Burmese (98.1%, a difference of 0.010%), Hmong (98.1%, a difference of 0.010%), and Filipino (98.0%, a difference of 0.010%).
| Demographics | Rating | Rank | Kindergarten |
| Blackfeet | 87.8 /100 | #137 | Excellent 98.1% |
| Immigrants | Romania | 87.7 /100 | #138 | Excellent 98.1% |
| Israelis | 87.7 /100 | #139 | Excellent 98.1% |
| Palestinians | 83.6 /100 | #140 | Excellent 98.1% |
| Marshallese | 83.0 /100 | #141 | Excellent 98.1% |
| Immigrants | Turkey | 82.8 /100 | #142 | Excellent 98.1% |
| Burmese | 81.5 /100 | #143 | Excellent 98.1% |
| Alsatians | 80.4 /100 | #144 | Excellent 98.1% |
| Hmong | 78.8 /100 | #145 | Good 98.1% |
| Filipinos | 78.3 /100 | #146 | Good 98.0% |
| Immigrants | Israel | 77.6 /100 | #147 | Good 98.0% |
| Apache | 75.0 /100 | #148 | Good 98.0% |
| Immigrants | Greece | 74.9 /100 | #149 | Good 98.0% |
| Jordanians | 72.8 /100 | #150 | Good 98.0% |
| Soviet Union | 70.8 /100 | #151 | Good 98.0% |
Demographics Similar to Cajuns by Kindergarten
In terms of kindergarten, the demographic groups most similar to Cajuns are Immigrants from Netherlands (98.3%, a difference of 0.010%), Cherokee (98.3%, a difference of 0.010%), Immigrants from England (98.3%, a difference of 0.010%), Delaware (98.3%, a difference of 0.020%), and Shoshone (98.3%, a difference of 0.020%).
| Demographics | Rating | Rank | Kindergarten |
| Cheyenne | 99.6 /100 | #66 | Exceptional 98.4% |
| Canadians | 99.6 /100 | #67 | Exceptional 98.4% |
| Immigrants | Northern Europe | 99.6 /100 | #68 | Exceptional 98.4% |
| Immigrants | Austria | 99.6 /100 | #69 | Exceptional 98.4% |
| Russians | 99.6 /100 | #70 | Exceptional 98.4% |
| Chickasaw | 99.6 /100 | #71 | Exceptional 98.4% |
| Serbians | 99.6 /100 | #72 | Exceptional 98.4% |
| Cajuns | 99.4 /100 | #73 | Exceptional 98.3% |
| Immigrants | Netherlands | 99.3 /100 | #74 | Exceptional 98.3% |
| Cherokee | 99.3 /100 | #75 | Exceptional 98.3% |
| Immigrants | England | 99.3 /100 | #76 | Exceptional 98.3% |
| Delaware | 99.3 /100 | #77 | Exceptional 98.3% |
| Shoshone | 99.2 /100 | #78 | Exceptional 98.3% |
| Immigrants | Belgium | 99.2 /100 | #79 | Exceptional 98.3% |
| Immigrants | Lithuania | 99.2 /100 | #80 | Exceptional 98.3% |