Thai vs Immigrants from Southern Europe Bachelor's Degree
COMPARE
Thai
Immigrants from Southern Europe
Bachelor's Degree
Bachelor's Degree Comparison
Thais
Immigrants from Southern Europe
50.1%
BACHELOR'S DEGREE
100.0/ 100
METRIC RATING
8th/ 347
METRIC RANK
40.0%
BACHELOR'S DEGREE
91.1/ 100
METRIC RATING
133rd/ 347
METRIC RANK
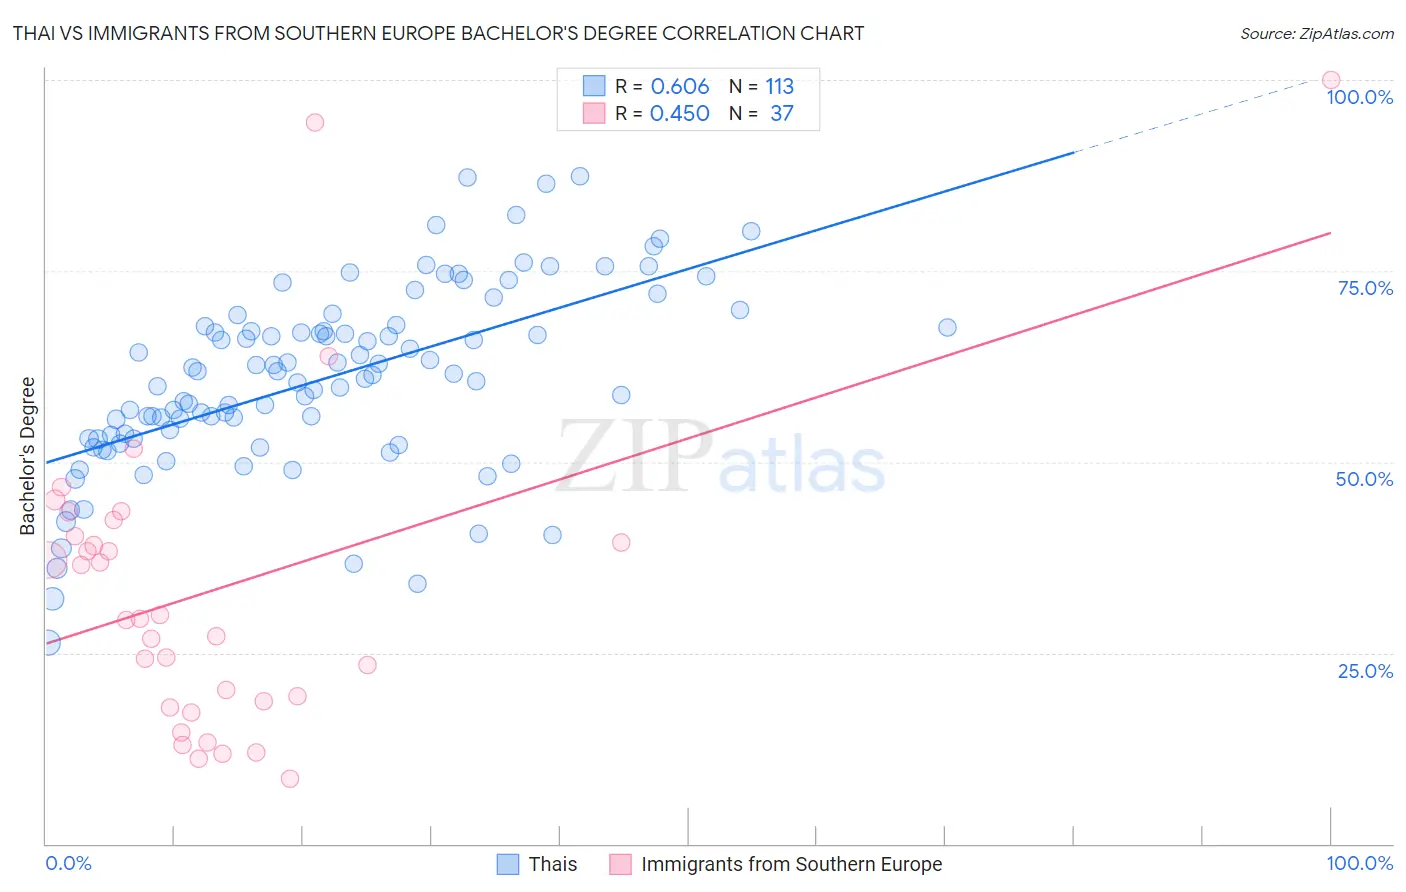
Thai vs Immigrants from Southern Europe Bachelor's Degree Correlation Chart
The statistical analysis conducted on geographies consisting of 475,734,010 people shows a significant positive correlation between the proportion of Thais and percentage of population with at least bachelor's degree education in the United States with a correlation coefficient (R) of 0.606 and weighted average of 50.1%. Similarly, the statistical analysis conducted on geographies consisting of 402,787,541 people shows a moderate positive correlation between the proportion of Immigrants from Southern Europe and percentage of population with at least bachelor's degree education in the United States with a correlation coefficient (R) of 0.450 and weighted average of 40.0%, a difference of 25.4%.
Bachelor's Degree Correlation Summary
| Measurement | Thai | Immigrants from Southern Europe |
| Minimum | 26.3% | 8.5% |
| Maximum | 87.4% | 100.0% |
| Range | 61.1% | 91.5% |
| Mean | 60.8% | 33.2% |
| Median | 61.3% | 29.4% |
| Interquartile 25% (IQ1) | 53.0% | 18.2% |
| Interquartile 75% (IQ3) | 67.7% | 41.4% |
| Interquartile Range (IQR) | 14.7% | 23.1% |
| Standard Deviation (Sample) | 12.0% | 20.4% |
| Standard Deviation (Population) | 12.0% | 20.1% |
Similar Demographics by Bachelor's Degree
Demographics Similar to Thais by Bachelor's Degree
In terms of bachelor's degree, the demographic groups most similar to Thais are Immigrants from Israel (50.0%, a difference of 0.24%), Immigrants from Iran (50.3%, a difference of 0.37%), Okinawan (50.5%, a difference of 0.85%), Iranian (51.0%, a difference of 1.7%), and Immigrants from Taiwan (51.2%, a difference of 2.1%).
| Demographics | Rating | Rank | Bachelor's Degree |
| Filipinos | 100.0 /100 | #1 | Exceptional 52.7% |
| Immigrants | Singapore | 100.0 /100 | #2 | Exceptional 51.9% |
| Immigrants | India | 100.0 /100 | #3 | Exceptional 51.3% |
| Immigrants | Taiwan | 100.0 /100 | #4 | Exceptional 51.2% |
| Iranians | 100.0 /100 | #5 | Exceptional 51.0% |
| Okinawans | 100.0 /100 | #6 | Exceptional 50.5% |
| Immigrants | Iran | 100.0 /100 | #7 | Exceptional 50.3% |
| Thais | 100.0 /100 | #8 | Exceptional 50.1% |
| Immigrants | Israel | 100.0 /100 | #9 | Exceptional 50.0% |
| Cypriots | 100.0 /100 | #10 | Exceptional 49.0% |
| Immigrants | Australia | 100.0 /100 | #11 | Exceptional 48.5% |
| Immigrants | China | 100.0 /100 | #12 | Exceptional 48.4% |
| Immigrants | South Central Asia | 100.0 /100 | #13 | Exceptional 48.3% |
| Immigrants | Hong Kong | 100.0 /100 | #14 | Exceptional 48.2% |
| Immigrants | Eastern Asia | 100.0 /100 | #15 | Exceptional 48.1% |
Demographics Similar to Immigrants from Southern Europe by Bachelor's Degree
In terms of bachelor's degree, the demographic groups most similar to Immigrants from Southern Europe are Taiwanese (40.0%, a difference of 0.010%), Italian (40.1%, a difference of 0.25%), Sierra Leonean (40.1%, a difference of 0.33%), Serbian (40.1%, a difference of 0.40%), and Assyrian/Chaldean/Syriac (39.8%, a difference of 0.43%).
| Demographics | Rating | Rank | Bachelor's Degree |
| Immigrants | Eastern Africa | 94.1 /100 | #126 | Exceptional 40.4% |
| Immigrants | Jordan | 93.4 /100 | #127 | Exceptional 40.3% |
| Immigrants | Venezuela | 92.9 /100 | #128 | Exceptional 40.2% |
| Serbians | 92.4 /100 | #129 | Exceptional 40.1% |
| Sierra Leoneans | 92.2 /100 | #130 | Exceptional 40.1% |
| Italians | 91.9 /100 | #131 | Exceptional 40.1% |
| Taiwanese | 91.1 /100 | #132 | Exceptional 40.0% |
| Immigrants | Southern Europe | 91.1 /100 | #133 | Exceptional 40.0% |
| Assyrians/Chaldeans/Syriacs | 89.4 /100 | #134 | Excellent 39.8% |
| Luxembourgers | 89.1 /100 | #135 | Excellent 39.8% |
| Pakistanis | 88.2 /100 | #136 | Excellent 39.7% |
| Icelanders | 86.5 /100 | #137 | Excellent 39.5% |
| Europeans | 85.6 /100 | #138 | Excellent 39.5% |
| Immigrants | Sudan | 84.5 /100 | #139 | Excellent 39.4% |
| Immigrants | Armenia | 84.1 /100 | #140 | Excellent 39.4% |