South American vs Immigrants from Southern Europe Bachelor's Degree
COMPARE
South American
Immigrants from Southern Europe
Bachelor's Degree
Bachelor's Degree Comparison
South Americans
Immigrants from Southern Europe
38.9%
BACHELOR'S DEGREE
77.3/ 100
METRIC RATING
150th/ 347
METRIC RANK
40.0%
BACHELOR'S DEGREE
91.1/ 100
METRIC RATING
133rd/ 347
METRIC RANK
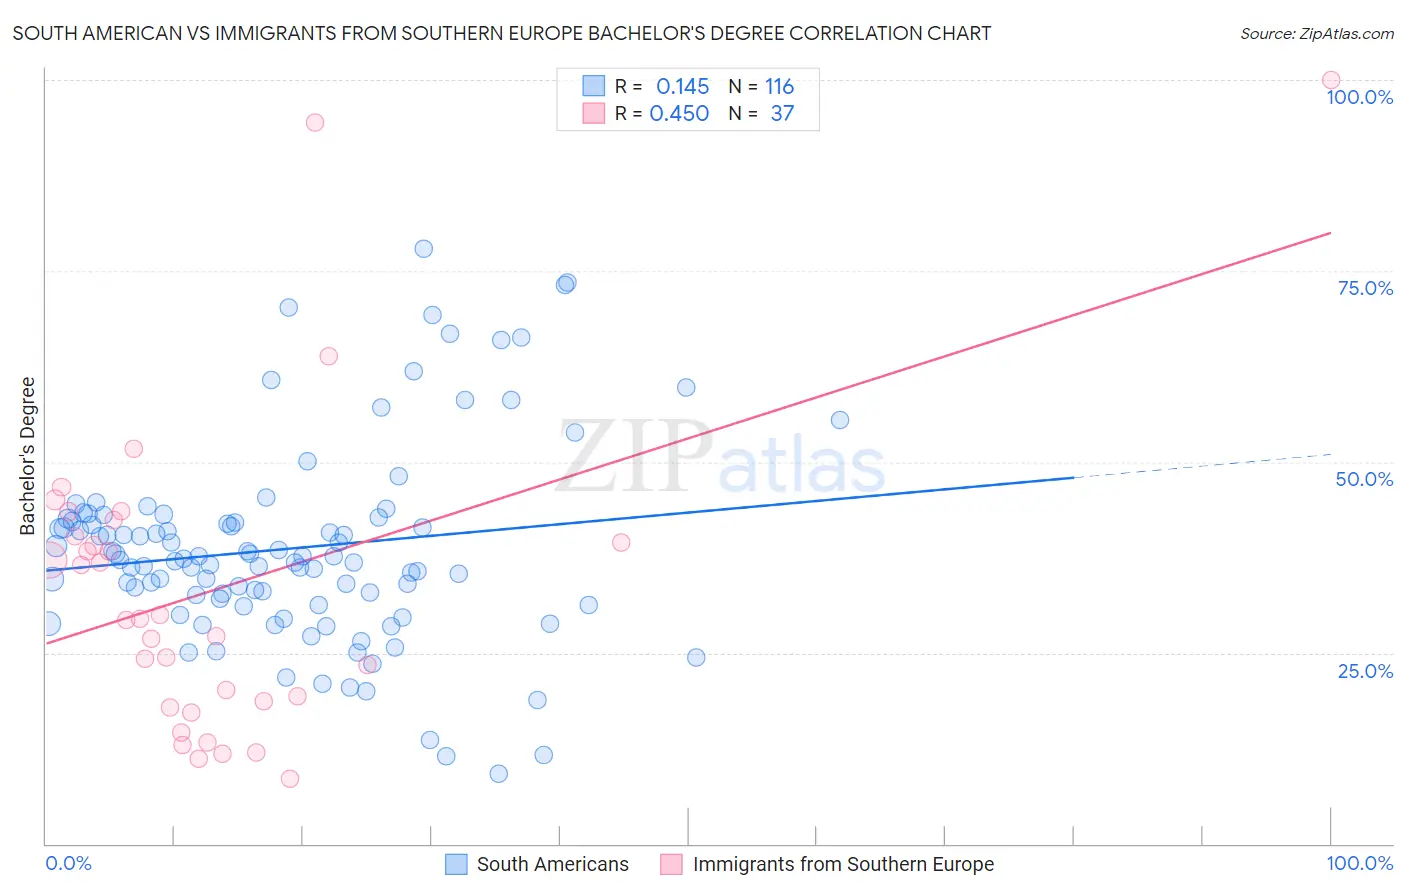
South American vs Immigrants from Southern Europe Bachelor's Degree Correlation Chart
The statistical analysis conducted on geographies consisting of 494,094,255 people shows a poor positive correlation between the proportion of South Americans and percentage of population with at least bachelor's degree education in the United States with a correlation coefficient (R) of 0.145 and weighted average of 38.9%. Similarly, the statistical analysis conducted on geographies consisting of 402,787,541 people shows a moderate positive correlation between the proportion of Immigrants from Southern Europe and percentage of population with at least bachelor's degree education in the United States with a correlation coefficient (R) of 0.450 and weighted average of 40.0%, a difference of 2.6%.
Bachelor's Degree Correlation Summary
| Measurement | South American | Immigrants from Southern Europe |
| Minimum | 9.1% | 8.5% |
| Maximum | 77.9% | 100.0% |
| Range | 68.8% | 91.5% |
| Mean | 38.6% | 33.2% |
| Median | 37.2% | 29.4% |
| Interquartile 25% (IQ1) | 31.7% | 18.2% |
| Interquartile 75% (IQ3) | 42.4% | 41.4% |
| Interquartile Range (IQR) | 10.7% | 23.1% |
| Standard Deviation (Sample) | 13.0% | 20.4% |
| Standard Deviation (Population) | 12.9% | 20.1% |
Demographics Similar to South Americans and Immigrants from Southern Europe by Bachelor's Degree
In terms of bachelor's degree, the demographic groups most similar to South Americans are Immigrants from Poland (39.0%, a difference of 0.030%), Immigrants from Africa (38.9%, a difference of 0.10%), Iraqi (39.0%, a difference of 0.11%), Immigrants from Sierra Leone (39.0%, a difference of 0.24%), and Swedish (39.1%, a difference of 0.27%). Similarly, the demographic groups most similar to Immigrants from Southern Europe are Taiwanese (40.0%, a difference of 0.010%), Italian (40.1%, a difference of 0.25%), Assyrian/Chaldean/Syriac (39.8%, a difference of 0.43%), Luxembourger (39.8%, a difference of 0.51%), and Pakistani (39.7%, a difference of 0.71%).
| Demographics | Rating | Rank | Bachelor's Degree |
| Italians | 91.9 /100 | #131 | Exceptional 40.1% |
| Taiwanese | 91.1 /100 | #132 | Exceptional 40.0% |
| Immigrants | Southern Europe | 91.1 /100 | #133 | Exceptional 40.0% |
| Assyrians/Chaldeans/Syriacs | 89.4 /100 | #134 | Excellent 39.8% |
| Luxembourgers | 89.1 /100 | #135 | Excellent 39.8% |
| Pakistanis | 88.2 /100 | #136 | Excellent 39.7% |
| Icelanders | 86.5 /100 | #137 | Excellent 39.5% |
| Europeans | 85.6 /100 | #138 | Excellent 39.5% |
| Immigrants | Sudan | 84.5 /100 | #139 | Excellent 39.4% |
| Immigrants | Armenia | 84.1 /100 | #140 | Excellent 39.4% |
| South American Indians | 83.6 /100 | #141 | Excellent 39.3% |
| Immigrants | North Macedonia | 81.6 /100 | #142 | Excellent 39.2% |
| Poles | 79.8 /100 | #143 | Good 39.1% |
| Immigrants | Afghanistan | 79.7 /100 | #144 | Good 39.1% |
| Slovenes | 79.5 /100 | #145 | Good 39.1% |
| Swedes | 79.2 /100 | #146 | Good 39.1% |
| Immigrants | Sierra Leone | 79.0 /100 | #147 | Good 39.0% |
| Iraqis | 78.1 /100 | #148 | Good 39.0% |
| Immigrants | Poland | 77.5 /100 | #149 | Good 39.0% |
| South Americans | 77.3 /100 | #150 | Good 38.9% |
| Immigrants | Africa | 76.5 /100 | #151 | Good 38.9% |