Thai vs Celtic 8th Grade
COMPARE
Thai
Celtic
8th Grade
8th Grade Comparison
Thais
Celtics
96.4%
8TH GRADE
98.9/ 100
METRIC RATING
91st/ 347
METRIC RANK
96.8%
8TH GRADE
99.9/ 100
METRIC RATING
51st/ 347
METRIC RANK
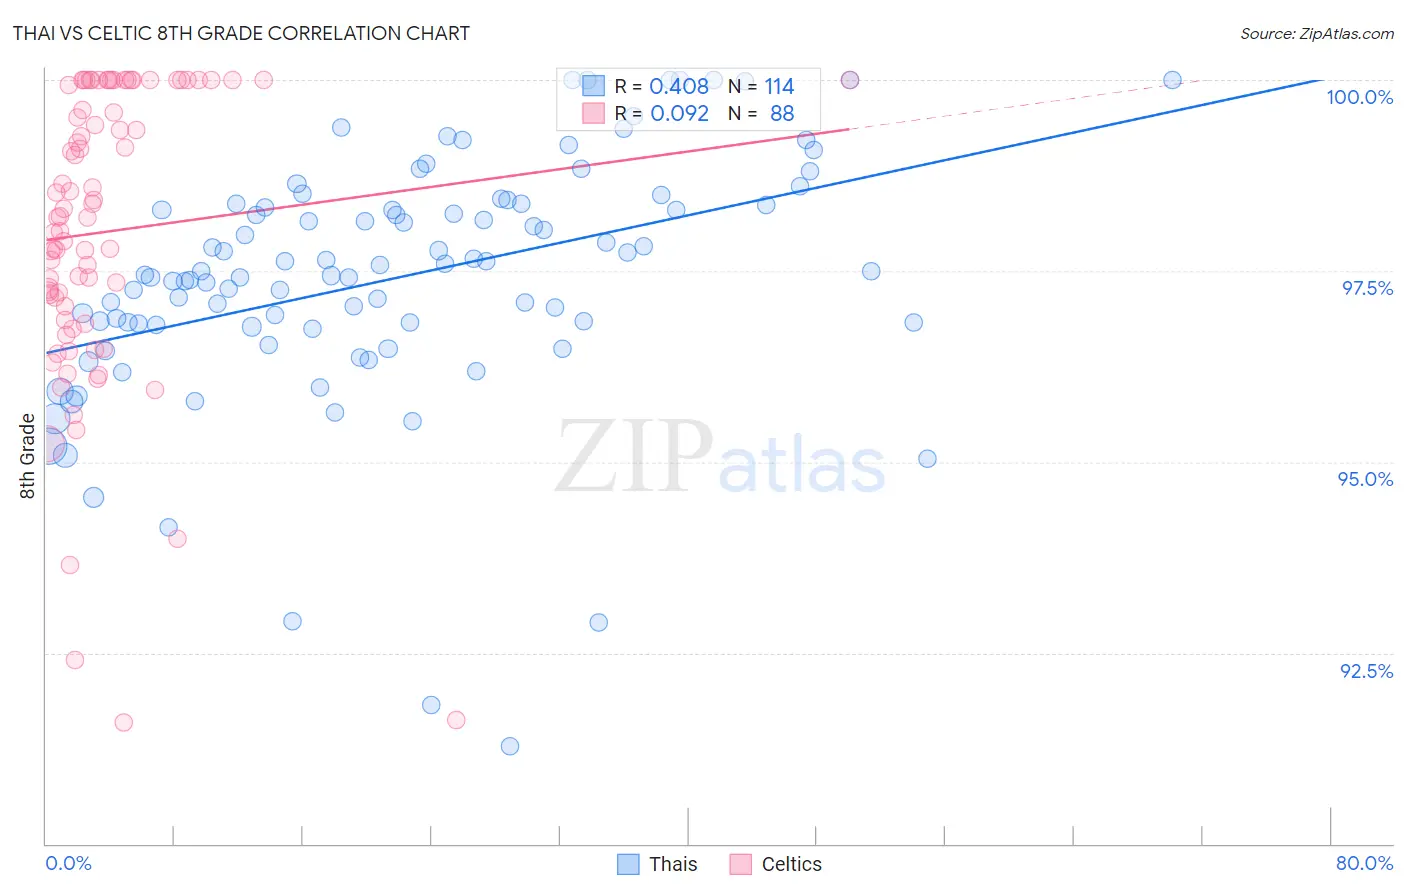
Thai vs Celtic 8th Grade Correlation Chart
The statistical analysis conducted on geographies consisting of 475,814,962 people shows a moderate positive correlation between the proportion of Thais and percentage of population with at least 8th grade education in the United States with a correlation coefficient (R) of 0.408 and weighted average of 96.4%. Similarly, the statistical analysis conducted on geographies consisting of 168,876,981 people shows a slight positive correlation between the proportion of Celtics and percentage of population with at least 8th grade education in the United States with a correlation coefficient (R) of 0.092 and weighted average of 96.8%, a difference of 0.38%.
8th Grade Correlation Summary
| Measurement | Thai | Celtic |
| Minimum | 91.3% | 91.6% |
| Maximum | 100.0% | 100.0% |
| Range | 8.7% | 8.4% |
| Mean | 97.4% | 98.0% |
| Median | 97.5% | 98.2% |
| Interquartile 25% (IQ1) | 96.8% | 96.9% |
| Interquartile 75% (IQ3) | 98.4% | 100.0% |
| Interquartile Range (IQR) | 1.6% | 3.1% |
| Standard Deviation (Sample) | 1.6% | 1.9% |
| Standard Deviation (Population) | 1.6% | 1.9% |
Similar Demographics by 8th Grade
Demographics Similar to Thais by 8th Grade
In terms of 8th grade, the demographic groups most similar to Thais are Immigrants from Sweden (96.4%, a difference of 0.0%), Menominee (96.4%, a difference of 0.0%), Immigrants from Denmark (96.4%, a difference of 0.0%), Chickasaw (96.4%, a difference of 0.010%), and Immigrants from Singapore (96.4%, a difference of 0.010%).
| Demographics | Rating | Rank | 8th Grade |
| Immigrants | Belgium | 99.1 /100 | #84 | Exceptional 96.5% |
| Immigrants | South Africa | 99.1 /100 | #85 | Exceptional 96.5% |
| Cherokee | 99.0 /100 | #86 | Exceptional 96.5% |
| Immigrants | Australia | 99.0 /100 | #87 | Exceptional 96.5% |
| Immigrants | Western Europe | 99.0 /100 | #88 | Exceptional 96.4% |
| Chickasaw | 98.9 /100 | #89 | Exceptional 96.4% |
| Immigrants | Sweden | 98.9 /100 | #90 | Exceptional 96.4% |
| Thais | 98.9 /100 | #91 | Exceptional 96.4% |
| Menominee | 98.9 /100 | #92 | Exceptional 96.4% |
| Immigrants | Denmark | 98.8 /100 | #93 | Exceptional 96.4% |
| Immigrants | Singapore | 98.8 /100 | #94 | Exceptional 96.4% |
| German Russians | 98.8 /100 | #95 | Exceptional 96.4% |
| Potawatomi | 98.7 /100 | #96 | Exceptional 96.4% |
| Osage | 98.7 /100 | #97 | Exceptional 96.4% |
| Immigrants | Germany | 98.7 /100 | #98 | Exceptional 96.4% |
Demographics Similar to Celtics by 8th Grade
In terms of 8th grade, the demographic groups most similar to Celtics are Immigrants from Scotland (96.8%, a difference of 0.010%), Estonian (96.8%, a difference of 0.020%), Slavic (96.8%, a difference of 0.030%), Greek (96.8%, a difference of 0.030%), and Austrian (96.7%, a difference of 0.050%).
| Demographics | Rating | Rank | 8th Grade |
| Maltese | 99.9 /100 | #44 | Exceptional 96.9% |
| Northern Europeans | 99.9 /100 | #45 | Exceptional 96.9% |
| Czechoslovakians | 99.9 /100 | #46 | Exceptional 96.9% |
| Bulgarians | 99.9 /100 | #47 | Exceptional 96.9% |
| Slavs | 99.9 /100 | #48 | Exceptional 96.8% |
| Estonians | 99.9 /100 | #49 | Exceptional 96.8% |
| Immigrants | Scotland | 99.9 /100 | #50 | Exceptional 96.8% |
| Celtics | 99.9 /100 | #51 | Exceptional 96.8% |
| Greeks | 99.9 /100 | #52 | Exceptional 96.8% |
| Austrians | 99.9 /100 | #53 | Exceptional 96.7% |
| Serbians | 99.8 /100 | #54 | Exceptional 96.7% |
| Russians | 99.8 /100 | #55 | Exceptional 96.7% |
| Australians | 99.8 /100 | #56 | Exceptional 96.7% |
| Macedonians | 99.8 /100 | #57 | Exceptional 96.7% |
| Immigrants | Canada | 99.8 /100 | #58 | Exceptional 96.7% |