Swedish vs Afghan 2nd Grade
COMPARE
Swedish
Afghan
2nd Grade
2nd Grade Comparison
Swedes
Afghans
98.6%
2ND GRADE
100.0/ 100
METRIC RATING
14th/ 347
METRIC RANK
97.3%
2ND GRADE
0.1/ 100
METRIC RATING
280th/ 347
METRIC RANK
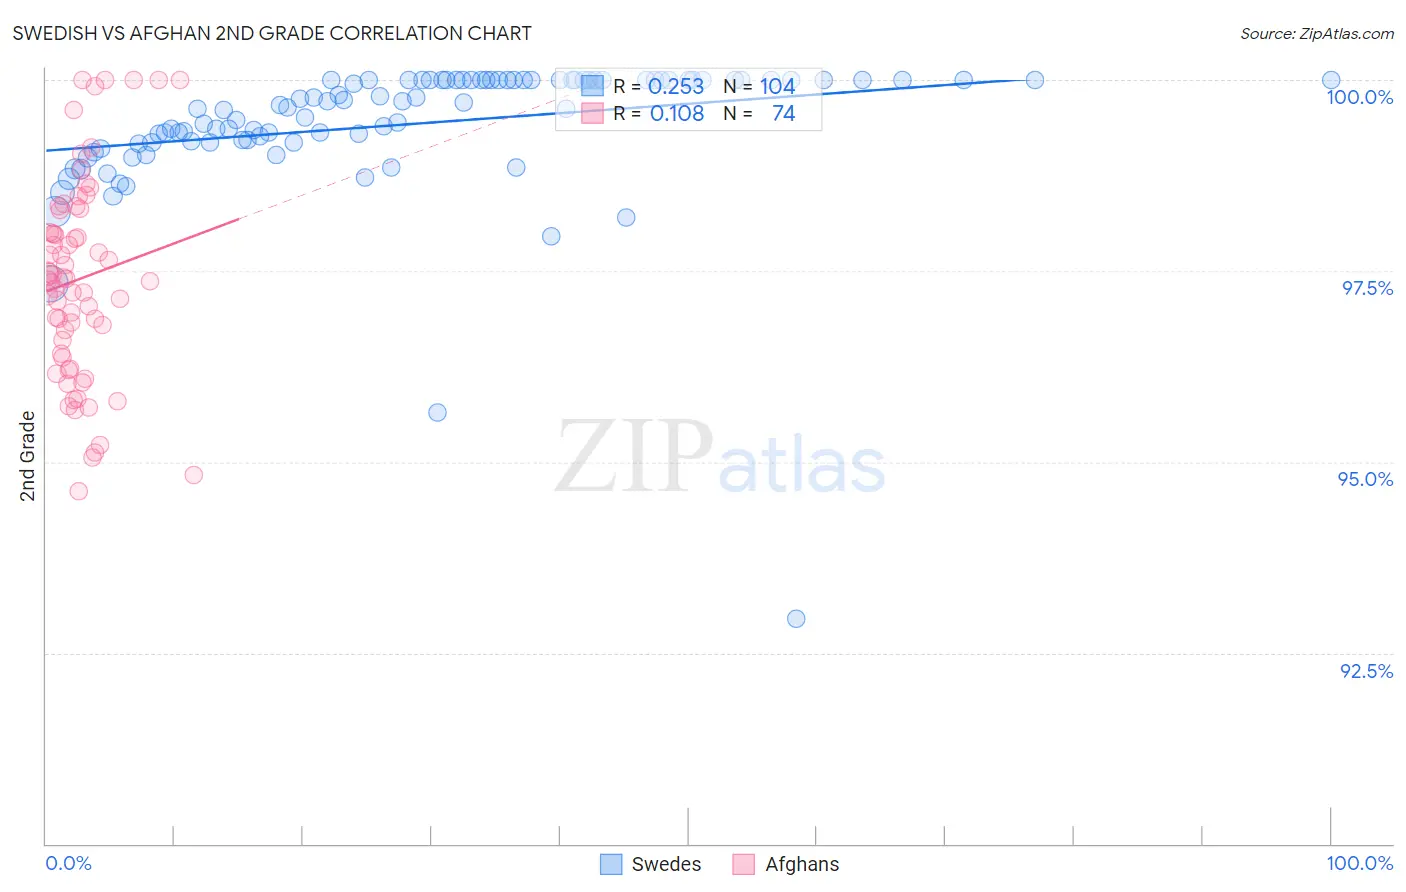
Swedish vs Afghan 2nd Grade Correlation Chart
The statistical analysis conducted on geographies consisting of 539,231,492 people shows a weak positive correlation between the proportion of Swedes and percentage of population with at least 2nd grade education in the United States with a correlation coefficient (R) of 0.253 and weighted average of 98.6%. Similarly, the statistical analysis conducted on geographies consisting of 148,851,685 people shows a poor positive correlation between the proportion of Afghans and percentage of population with at least 2nd grade education in the United States with a correlation coefficient (R) of 0.108 and weighted average of 97.3%, a difference of 1.3%.
2nd Grade Correlation Summary
| Measurement | Swedish | Afghan |
| Minimum | 92.9% | 94.6% |
| Maximum | 100.0% | 100.0% |
| Range | 7.1% | 5.4% |
| Mean | 99.4% | 97.4% |
| Median | 99.7% | 97.4% |
| Interquartile 25% (IQ1) | 99.2% | 96.4% |
| Interquartile 75% (IQ3) | 100.0% | 98.3% |
| Interquartile Range (IQR) | 0.81% | 1.9% |
| Standard Deviation (Sample) | 0.93% | 1.3% |
| Standard Deviation (Population) | 0.92% | 1.3% |
Similar Demographics by 2nd Grade
Demographics Similar to Swedes by 2nd Grade
In terms of 2nd grade, the demographic groups most similar to Swedes are English (98.6%, a difference of 0.010%), Tlingit-Haida (98.6%, a difference of 0.020%), Carpatho Rusyn (98.6%, a difference of 0.020%), Scottish (98.6%, a difference of 0.020%), and Dutch (98.6%, a difference of 0.020%).
| Demographics | Rating | Rank | 2nd Grade |
| Norwegians | 100.0 /100 | #7 | Exceptional 98.7% |
| Germans | 100.0 /100 | #8 | Exceptional 98.7% |
| Slovaks | 100.0 /100 | #9 | Exceptional 98.7% |
| Slovenes | 100.0 /100 | #10 | Exceptional 98.6% |
| Tlingit-Haida | 100.0 /100 | #11 | Exceptional 98.6% |
| Carpatho Rusyns | 100.0 /100 | #12 | Exceptional 98.6% |
| English | 100.0 /100 | #13 | Exceptional 98.6% |
| Swedes | 100.0 /100 | #14 | Exceptional 98.6% |
| Scottish | 100.0 /100 | #15 | Exceptional 98.6% |
| Dutch | 100.0 /100 | #16 | Exceptional 98.6% |
| Aleuts | 100.0 /100 | #17 | Exceptional 98.6% |
| Irish | 100.0 /100 | #18 | Exceptional 98.6% |
| Finns | 100.0 /100 | #19 | Exceptional 98.5% |
| Sioux | 100.0 /100 | #20 | Exceptional 98.5% |
| Lithuanians | 100.0 /100 | #21 | Exceptional 98.5% |
Demographics Similar to Afghans by 2nd Grade
In terms of 2nd grade, the demographic groups most similar to Afghans are Immigrants from Ghana (97.3%, a difference of 0.0%), Trinidadian and Tobagonian (97.3%, a difference of 0.0%), Barbadian (97.3%, a difference of 0.010%), Immigrants from Western Africa (97.3%, a difference of 0.020%), and Immigrants from Uzbekistan (97.3%, a difference of 0.020%).
| Demographics | Rating | Rank | 2nd Grade |
| Immigrants | Bolivia | 0.1 /100 | #273 | Tragic 97.4% |
| Ghanaians | 0.1 /100 | #274 | Tragic 97.4% |
| Immigrants | China | 0.1 /100 | #275 | Tragic 97.3% |
| Immigrants | Philippines | 0.1 /100 | #276 | Tragic 97.3% |
| Immigrants | Western Africa | 0.1 /100 | #277 | Tragic 97.3% |
| Immigrants | Uzbekistan | 0.1 /100 | #278 | Tragic 97.3% |
| Immigrants | Ghana | 0.1 /100 | #279 | Tragic 97.3% |
| Afghans | 0.1 /100 | #280 | Tragic 97.3% |
| Trinidadians and Tobagonians | 0.1 /100 | #281 | Tragic 97.3% |
| Barbadians | 0.1 /100 | #282 | Tragic 97.3% |
| Immigrants | Trinidad and Tobago | 0.0 /100 | #283 | Tragic 97.2% |
| Immigrants | West Indies | 0.0 /100 | #284 | Tragic 97.2% |
| Immigrants | Hong Kong | 0.0 /100 | #285 | Tragic 97.2% |
| Immigrants | Barbados | 0.0 /100 | #286 | Tragic 97.2% |
| Immigrants | Portugal | 0.0 /100 | #287 | Tragic 97.2% |