Immigrants from Pakistan vs Afghan 2nd Grade
COMPARE
Immigrants from Pakistan
Afghan
2nd Grade
2nd Grade Comparison
Immigrants from Pakistan
Afghans
97.6%
2ND GRADE
2.3/ 100
METRIC RATING
231st/ 347
METRIC RANK
97.3%
2ND GRADE
0.1/ 100
METRIC RATING
280th/ 347
METRIC RANK
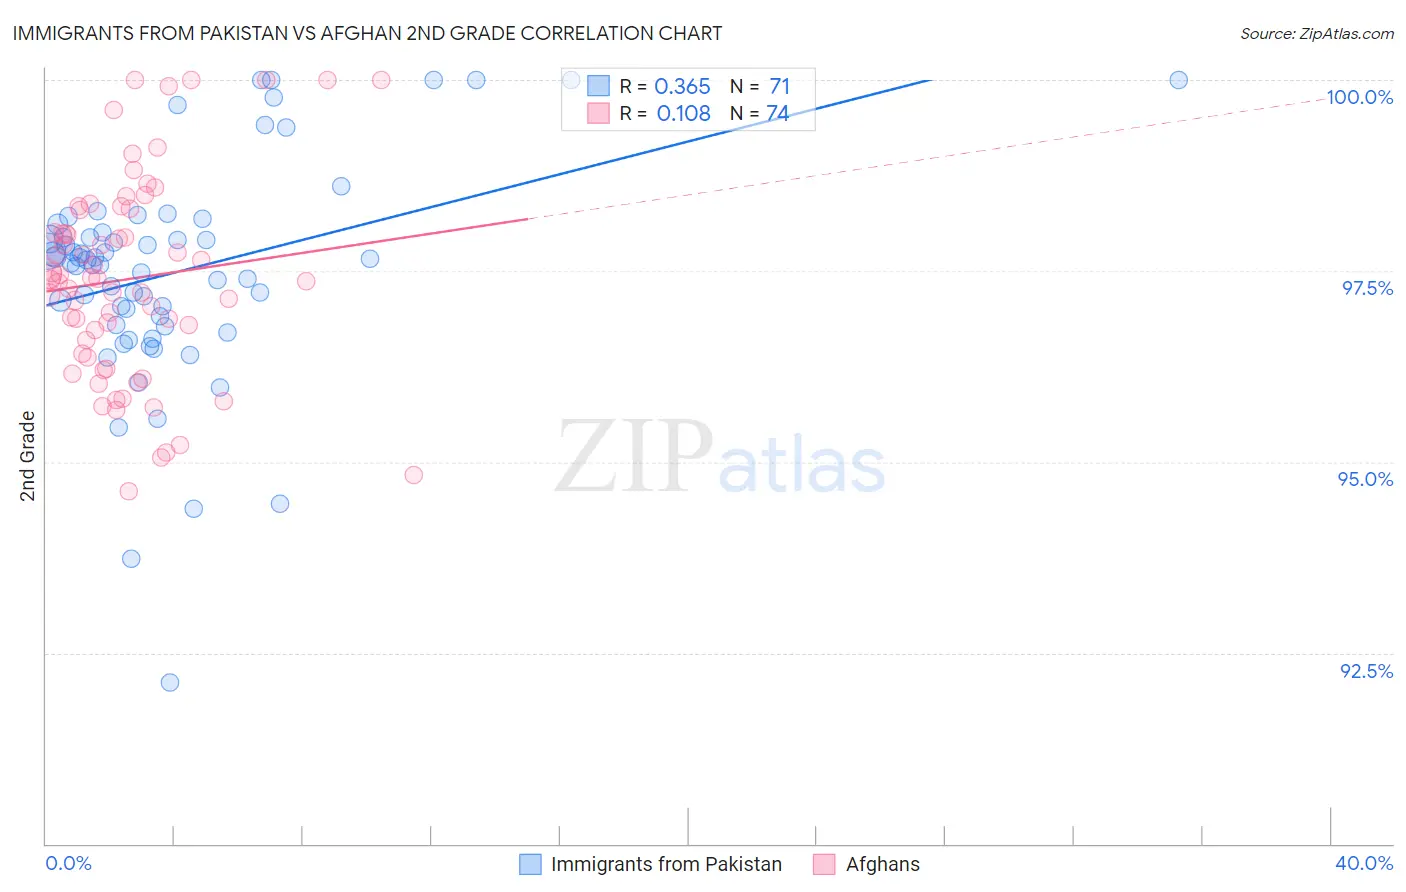
Immigrants from Pakistan vs Afghan 2nd Grade Correlation Chart
The statistical analysis conducted on geographies consisting of 283,900,935 people shows a mild positive correlation between the proportion of Immigrants from Pakistan and percentage of population with at least 2nd grade education in the United States with a correlation coefficient (R) of 0.365 and weighted average of 97.6%. Similarly, the statistical analysis conducted on geographies consisting of 148,851,685 people shows a poor positive correlation between the proportion of Afghans and percentage of population with at least 2nd grade education in the United States with a correlation coefficient (R) of 0.108 and weighted average of 97.3%, a difference of 0.29%.
2nd Grade Correlation Summary
| Measurement | Immigrants from Pakistan | Afghan |
| Minimum | 92.1% | 94.6% |
| Maximum | 100.0% | 100.0% |
| Range | 7.9% | 5.4% |
| Mean | 97.5% | 97.4% |
| Median | 97.6% | 97.4% |
| Interquartile 25% (IQ1) | 96.8% | 96.4% |
| Interquartile 75% (IQ3) | 98.0% | 98.3% |
| Interquartile Range (IQR) | 1.2% | 1.9% |
| Standard Deviation (Sample) | 1.4% | 1.3% |
| Standard Deviation (Population) | 1.4% | 1.3% |
Similar Demographics by 2nd Grade
Demographics Similar to Immigrants from Pakistan by 2nd Grade
In terms of 2nd grade, the demographic groups most similar to Immigrants from Pakistan are Immigrants from Western Asia (97.6%, a difference of 0.010%), Immigrants from Uruguay (97.6%, a difference of 0.010%), Immigrants from Malaysia (97.6%, a difference of 0.010%), Colombian (97.6%, a difference of 0.010%), and Immigrants from Costa Rica (97.6%, a difference of 0.020%).
| Demographics | Rating | Rank | 2nd Grade |
| Immigrants | Zaire | 4.3 /100 | #224 | Tragic 97.6% |
| Tongans | 4.3 /100 | #225 | Tragic 97.6% |
| Immigrants | Syria | 4.0 /100 | #226 | Tragic 97.6% |
| Immigrants | Nepal | 4.0 /100 | #227 | Tragic 97.6% |
| Sub-Saharan Africans | 3.4 /100 | #228 | Tragic 97.6% |
| Immigrants | Costa Rica | 3.1 /100 | #229 | Tragic 97.6% |
| Senegalese | 3.1 /100 | #230 | Tragic 97.6% |
| Immigrants | Pakistan | 2.3 /100 | #231 | Tragic 97.6% |
| Immigrants | Western Asia | 2.1 /100 | #232 | Tragic 97.6% |
| Immigrants | Uruguay | 2.1 /100 | #233 | Tragic 97.6% |
| Immigrants | Malaysia | 2.0 /100 | #234 | Tragic 97.6% |
| Colombians | 1.9 /100 | #235 | Tragic 97.6% |
| Nigerians | 1.7 /100 | #236 | Tragic 97.6% |
| U.S. Virgin Islanders | 1.6 /100 | #237 | Tragic 97.6% |
| Immigrants | Eastern Asia | 1.6 /100 | #238 | Tragic 97.6% |
Demographics Similar to Afghans by 2nd Grade
In terms of 2nd grade, the demographic groups most similar to Afghans are Immigrants from Ghana (97.3%, a difference of 0.0%), Trinidadian and Tobagonian (97.3%, a difference of 0.0%), Barbadian (97.3%, a difference of 0.010%), Immigrants from Western Africa (97.3%, a difference of 0.020%), and Immigrants from Uzbekistan (97.3%, a difference of 0.020%).
| Demographics | Rating | Rank | 2nd Grade |
| Immigrants | Bolivia | 0.1 /100 | #273 | Tragic 97.4% |
| Ghanaians | 0.1 /100 | #274 | Tragic 97.4% |
| Immigrants | China | 0.1 /100 | #275 | Tragic 97.3% |
| Immigrants | Philippines | 0.1 /100 | #276 | Tragic 97.3% |
| Immigrants | Western Africa | 0.1 /100 | #277 | Tragic 97.3% |
| Immigrants | Uzbekistan | 0.1 /100 | #278 | Tragic 97.3% |
| Immigrants | Ghana | 0.1 /100 | #279 | Tragic 97.3% |
| Afghans | 0.1 /100 | #280 | Tragic 97.3% |
| Trinidadians and Tobagonians | 0.1 /100 | #281 | Tragic 97.3% |
| Barbadians | 0.1 /100 | #282 | Tragic 97.3% |
| Immigrants | Trinidad and Tobago | 0.0 /100 | #283 | Tragic 97.2% |
| Immigrants | West Indies | 0.0 /100 | #284 | Tragic 97.2% |
| Immigrants | Hong Kong | 0.0 /100 | #285 | Tragic 97.2% |
| Immigrants | Barbados | 0.0 /100 | #286 | Tragic 97.2% |
| Immigrants | Portugal | 0.0 /100 | #287 | Tragic 97.2% |