Immigrants from Italy vs Paraguayan 12th Grade, No Diploma
COMPARE
Immigrants from Italy
Paraguayan
12th Grade, No Diploma
12th Grade, No Diploma Comparison
Immigrants from Italy
Paraguayans
91.7%
12TH GRADE, NO DIPLOMA
88.3/ 100
METRIC RATING
133rd/ 347
METRIC RANK
91.5%
12TH GRADE, NO DIPLOMA
78.9/ 100
METRIC RATING
150th/ 347
METRIC RANK
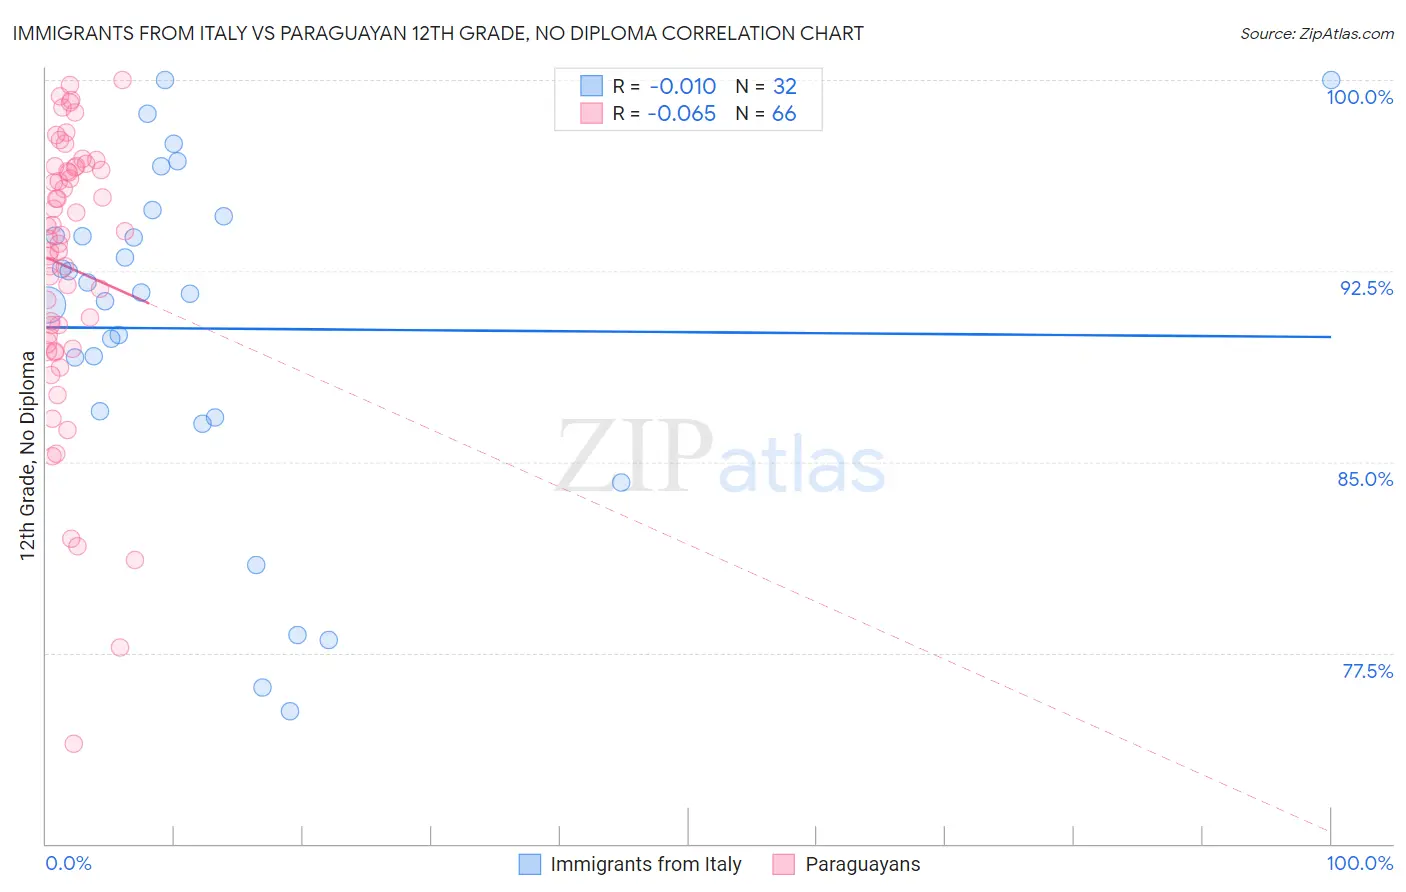
Immigrants from Italy vs Paraguayan 12th Grade, No Diploma Correlation Chart
The statistical analysis conducted on geographies consisting of 324,226,009 people shows no correlation between the proportion of Immigrants from Italy and percentage of population with at least 12th grade (no diploma) education in the United States with a correlation coefficient (R) of -0.010 and weighted average of 91.7%. Similarly, the statistical analysis conducted on geographies consisting of 95,114,201 people shows a slight negative correlation between the proportion of Paraguayans and percentage of population with at least 12th grade (no diploma) education in the United States with a correlation coefficient (R) of -0.065 and weighted average of 91.5%, a difference of 0.22%.
12th Grade, No Diploma Correlation Summary
| Measurement | Immigrants from Italy | Paraguayan |
| Minimum | 75.2% | 73.9% |
| Maximum | 100.0% | 100.0% |
| Range | 24.8% | 26.1% |
| Mean | 90.2% | 92.7% |
| Median | 91.6% | 93.8% |
| Interquartile 25% (IQ1) | 86.9% | 89.7% |
| Interquartile 75% (IQ3) | 94.3% | 96.6% |
| Interquartile Range (IQR) | 7.4% | 6.9% |
| Standard Deviation (Sample) | 6.7% | 5.4% |
| Standard Deviation (Population) | 6.6% | 5.4% |
Demographics Similar to Immigrants from Italy and Paraguayans by 12th Grade, No Diploma
In terms of 12th grade, no diploma, the demographic groups most similar to Immigrants from Italy are Venezuelan (91.7%, a difference of 0.0%), Albanian (91.8%, a difference of 0.030%), Immigrants from Eastern Asia (91.8%, a difference of 0.030%), Immigrants from Bosnia and Herzegovina (91.7%, a difference of 0.030%), and Chilean (91.7%, a difference of 0.070%). Similarly, the demographic groups most similar to Paraguayans are Ugandan (91.5%, a difference of 0.0%), Chippewa (91.5%, a difference of 0.0%), Pakistani (91.5%, a difference of 0.010%), Indian (Asian) (91.5%, a difference of 0.010%), and Immigrants from Spain (91.6%, a difference of 0.020%).
| Demographics | Rating | Rank | 12th Grade, No Diploma |
| Albanians | 89.3 /100 | #131 | Excellent 91.8% |
| Immigrants | Eastern Asia | 89.3 /100 | #132 | Excellent 91.8% |
| Immigrants | Italy | 88.3 /100 | #133 | Excellent 91.7% |
| Venezuelans | 88.2 /100 | #134 | Excellent 91.7% |
| Immigrants | Bosnia and Herzegovina | 87.3 /100 | #135 | Excellent 91.7% |
| Chileans | 85.8 /100 | #136 | Excellent 91.7% |
| Alaska Natives | 84.9 /100 | #137 | Excellent 91.6% |
| Arabs | 84.1 /100 | #138 | Excellent 91.6% |
| Immigrants | Egypt | 83.9 /100 | #139 | Excellent 91.6% |
| Immigrants | Poland | 82.3 /100 | #140 | Excellent 91.6% |
| Argentineans | 82.0 /100 | #141 | Excellent 91.6% |
| Immigrants | Venezuela | 80.9 /100 | #142 | Excellent 91.6% |
| Immigrants | Argentina | 80.7 /100 | #143 | Excellent 91.6% |
| Immigrants | Spain | 80.1 /100 | #144 | Excellent 91.6% |
| Immigrants | Lebanon | 80.0 /100 | #145 | Excellent 91.6% |
| Immigrants | Brazil | 79.8 /100 | #146 | Good 91.5% |
| Pakistanis | 79.6 /100 | #147 | Good 91.5% |
| Indians (Asian) | 79.4 /100 | #148 | Good 91.5% |
| Ugandans | 79.0 /100 | #149 | Good 91.5% |
| Paraguayans | 78.9 /100 | #150 | Good 91.5% |
| Chippewa | 78.8 /100 | #151 | Good 91.5% |