Sri Lankan vs Pakistani Bachelor's Degree
COMPARE
Sri Lankan
Pakistani
Bachelor's Degree
Bachelor's Degree Comparison
Sri Lankans
Pakistanis
38.2%
BACHELOR'S DEGREE
59.1/ 100
METRIC RATING
165th/ 347
METRIC RANK
39.7%
BACHELOR'S DEGREE
88.2/ 100
METRIC RATING
136th/ 347
METRIC RANK
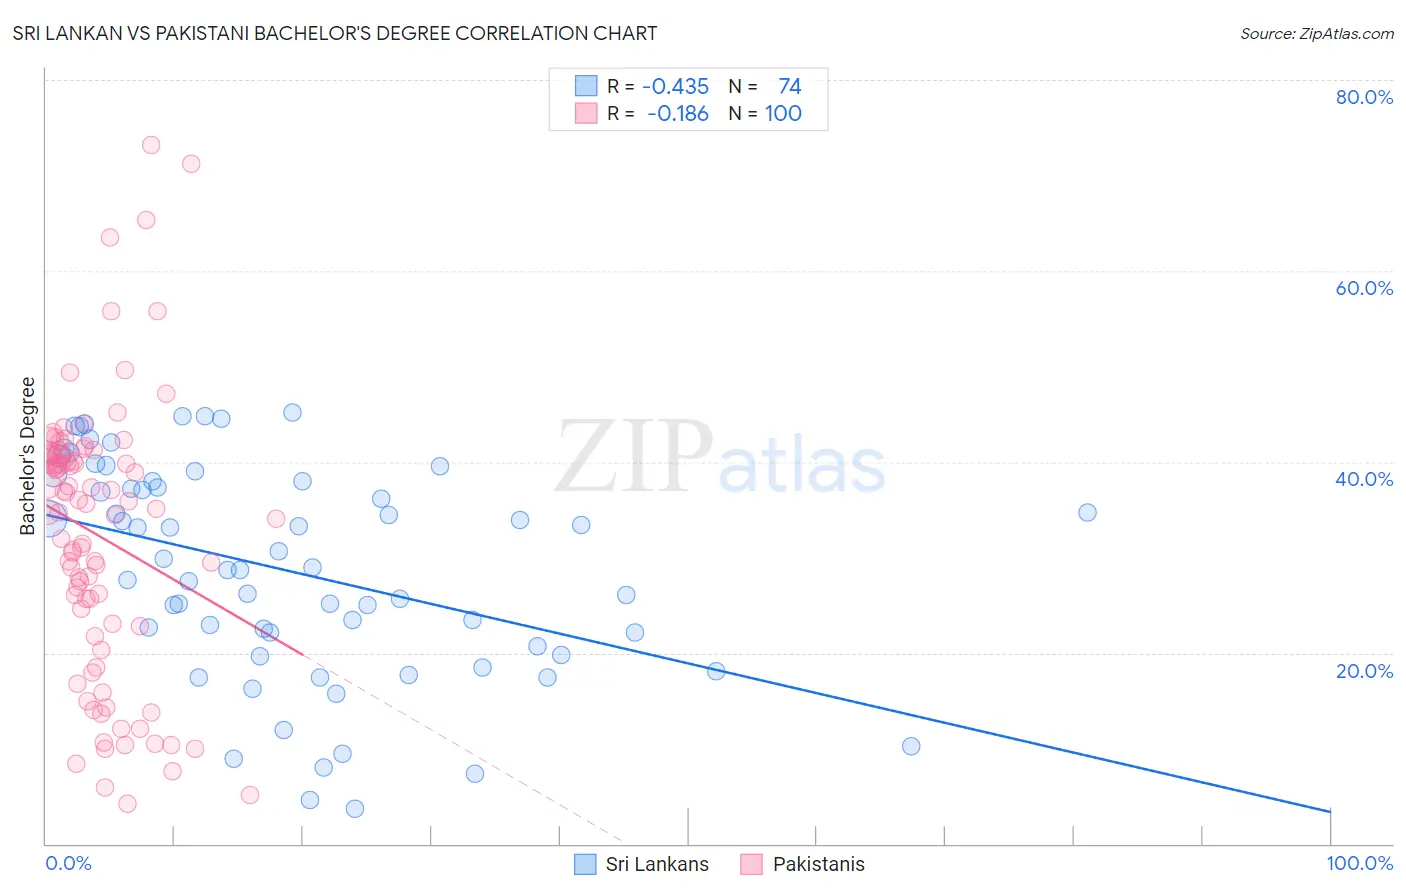
Sri Lankan vs Pakistani Bachelor's Degree Correlation Chart
The statistical analysis conducted on geographies consisting of 440,520,330 people shows a moderate negative correlation between the proportion of Sri Lankans and percentage of population with at least bachelor's degree education in the United States with a correlation coefficient (R) of -0.435 and weighted average of 38.2%. Similarly, the statistical analysis conducted on geographies consisting of 335,326,459 people shows a poor negative correlation between the proportion of Pakistanis and percentage of population with at least bachelor's degree education in the United States with a correlation coefficient (R) of -0.186 and weighted average of 39.7%, a difference of 4.0%.
Bachelor's Degree Correlation Summary
| Measurement | Sri Lankan | Pakistani |
| Minimum | 3.7% | 4.2% |
| Maximum | 45.1% | 73.2% |
| Range | 41.4% | 69.0% |
| Mean | 28.6% | 32.3% |
| Median | 28.8% | 35.3% |
| Interquartile 25% (IQ1) | 20.6% | 22.9% |
| Interquartile 75% (IQ3) | 37.9% | 40.7% |
| Interquartile Range (IQR) | 17.3% | 17.9% |
| Standard Deviation (Sample) | 11.1% | 14.3% |
| Standard Deviation (Population) | 11.0% | 14.3% |
Similar Demographics by Bachelor's Degree
Demographics Similar to Sri Lankans by Bachelor's Degree
In terms of bachelor's degree, the demographic groups most similar to Sri Lankans are Somali (38.1%, a difference of 0.050%), Scottish (38.1%, a difference of 0.25%), Danish (38.1%, a difference of 0.29%), Hungarian (38.3%, a difference of 0.30%), and Ghanaian (38.0%, a difference of 0.37%).
| Demographics | Rating | Rank | Bachelor's Degree |
| Immigrants | Germany | 69.6 /100 | #158 | Good 38.6% |
| Chinese | 66.6 /100 | #159 | Good 38.5% |
| Vietnamese | 66.6 /100 | #160 | Good 38.5% |
| Uruguayans | 65.8 /100 | #161 | Good 38.4% |
| Colombians | 65.0 /100 | #162 | Good 38.4% |
| Peruvians | 63.4 /100 | #163 | Good 38.3% |
| Hungarians | 62.1 /100 | #164 | Good 38.3% |
| Sri Lankans | 59.1 /100 | #165 | Average 38.2% |
| Somalis | 58.6 /100 | #166 | Average 38.1% |
| Scottish | 56.6 /100 | #167 | Average 38.1% |
| Danes | 56.2 /100 | #168 | Average 38.1% |
| Ghanaians | 55.3 /100 | #169 | Average 38.0% |
| Czechs | 54.4 /100 | #170 | Average 38.0% |
| Bermudans | 54.2 /100 | #171 | Average 38.0% |
| Immigrants | Somalia | 52.8 /100 | #172 | Average 37.9% |
Demographics Similar to Pakistanis by Bachelor's Degree
In terms of bachelor's degree, the demographic groups most similar to Pakistanis are Luxembourger (39.8%, a difference of 0.20%), Assyrian/Chaldean/Syriac (39.8%, a difference of 0.28%), Icelander (39.5%, a difference of 0.37%), European (39.5%, a difference of 0.54%), and Immigrants from Southern Europe (40.0%, a difference of 0.71%).
| Demographics | Rating | Rank | Bachelor's Degree |
| Serbians | 92.4 /100 | #129 | Exceptional 40.1% |
| Sierra Leoneans | 92.2 /100 | #130 | Exceptional 40.1% |
| Italians | 91.9 /100 | #131 | Exceptional 40.1% |
| Taiwanese | 91.1 /100 | #132 | Exceptional 40.0% |
| Immigrants | Southern Europe | 91.1 /100 | #133 | Exceptional 40.0% |
| Assyrians/Chaldeans/Syriacs | 89.4 /100 | #134 | Excellent 39.8% |
| Luxembourgers | 89.1 /100 | #135 | Excellent 39.8% |
| Pakistanis | 88.2 /100 | #136 | Excellent 39.7% |
| Icelanders | 86.5 /100 | #137 | Excellent 39.5% |
| Europeans | 85.6 /100 | #138 | Excellent 39.5% |
| Immigrants | Sudan | 84.5 /100 | #139 | Excellent 39.4% |
| Immigrants | Armenia | 84.1 /100 | #140 | Excellent 39.4% |
| South American Indians | 83.6 /100 | #141 | Excellent 39.3% |
| Immigrants | North Macedonia | 81.6 /100 | #142 | Excellent 39.2% |
| Poles | 79.8 /100 | #143 | Good 39.1% |