Spanish American vs White/Caucasian 6th Grade
COMPARE
Spanish American
White/Caucasian
6th Grade
6th Grade Comparison
Spanish Americans
Whites/Caucasians
97.0%
6TH GRADE
33.5/ 100
METRIC RATING
184th/ 347
METRIC RANK
97.7%
6TH GRADE
99.8/ 100
METRIC RATING
57th/ 347
METRIC RANK
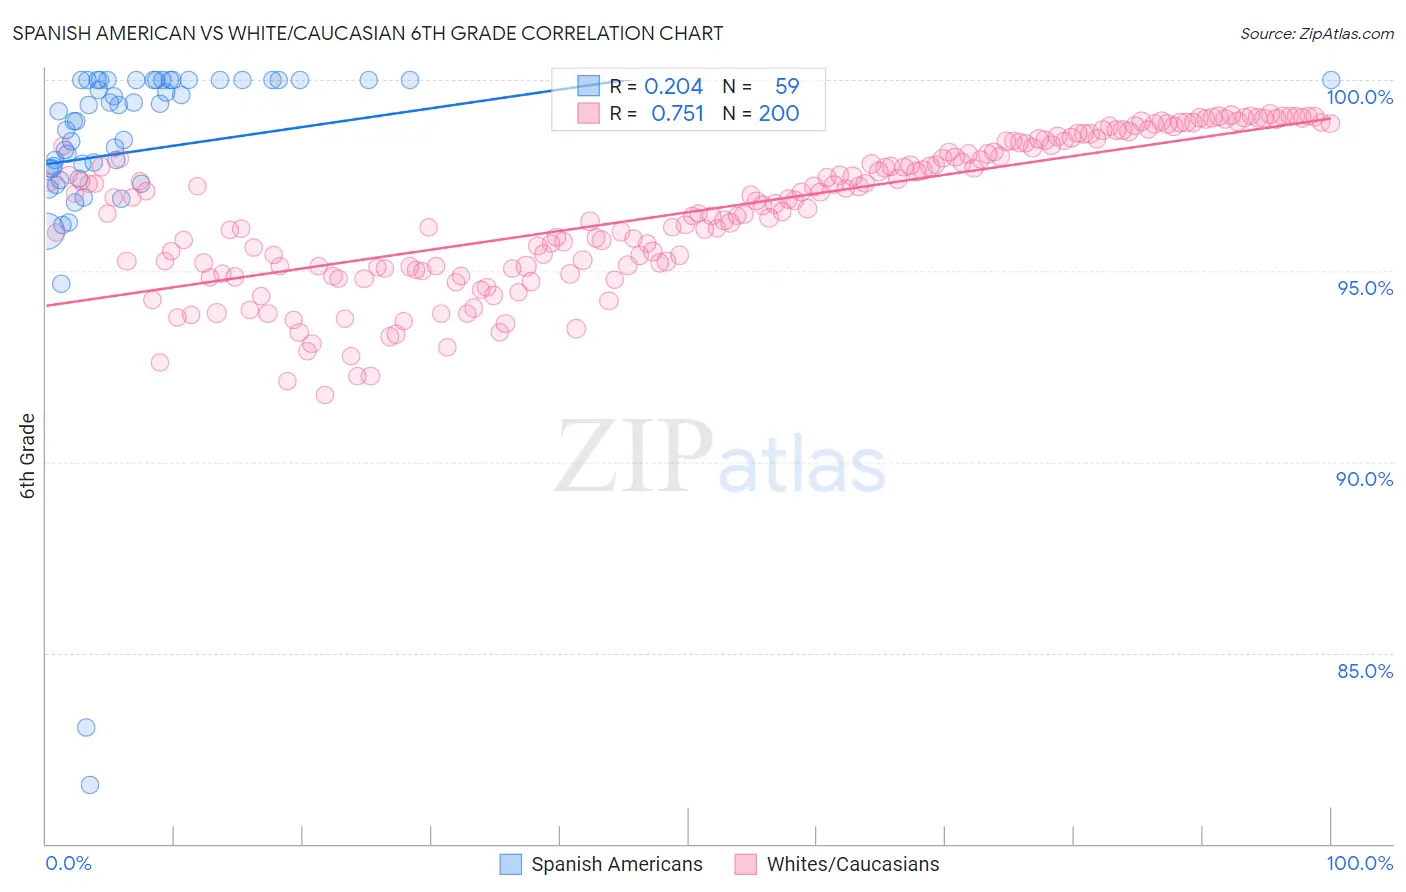
Spanish American vs White/Caucasian 6th Grade Correlation Chart
The statistical analysis conducted on geographies consisting of 103,168,542 people shows a weak positive correlation between the proportion of Spanish Americans and percentage of population with at least 6th grade education in the United States with a correlation coefficient (R) of 0.204 and weighted average of 97.0%. Similarly, the statistical analysis conducted on geographies consisting of 585,247,205 people shows a strong positive correlation between the proportion of Whites/Caucasians and percentage of population with at least 6th grade education in the United States with a correlation coefficient (R) of 0.751 and weighted average of 97.7%, a difference of 0.78%.
6th Grade Correlation Summary
| Measurement | Spanish American | White/Caucasian |
| Minimum | 81.5% | 91.7% |
| Maximum | 100.0% | 99.1% |
| Range | 18.5% | 7.4% |
| Mean | 98.2% | 96.5% |
| Median | 99.2% | 96.8% |
| Interquartile 25% (IQ1) | 97.7% | 95.1% |
| Interquartile 75% (IQ3) | 100.0% | 98.3% |
| Interquartile Range (IQR) | 2.3% | 3.2% |
| Standard Deviation (Sample) | 3.3% | 1.9% |
| Standard Deviation (Population) | 3.3% | 1.9% |
Similar Demographics by 6th Grade
Demographics Similar to Spanish Americans by 6th Grade
In terms of 6th grade, the demographic groups most similar to Spanish Americans are Immigrants from Venezuela (97.0%, a difference of 0.0%), Argentinean (97.0%, a difference of 0.0%), Immigrants from Ukraine (97.0%, a difference of 0.010%), Immigrants from Egypt (97.0%, a difference of 0.010%), and Comanche (97.0%, a difference of 0.020%).
| Demographics | Rating | Rank | 6th Grade |
| Mongolians | 46.7 /100 | #177 | Average 97.0% |
| Pakistanis | 46.0 /100 | #178 | Average 97.0% |
| Immigrants | Kenya | 45.3 /100 | #179 | Average 97.0% |
| Immigrants | Spain | 39.9 /100 | #180 | Fair 97.0% |
| Comanche | 37.9 /100 | #181 | Fair 97.0% |
| Immigrants | Ukraine | 35.6 /100 | #182 | Fair 97.0% |
| Immigrants | Venezuela | 34.5 /100 | #183 | Fair 97.0% |
| Spanish Americans | 33.5 /100 | #184 | Fair 97.0% |
| Argentineans | 33.0 /100 | #185 | Fair 97.0% |
| Immigrants | Egypt | 31.4 /100 | #186 | Fair 97.0% |
| Guamanians/Chamorros | 30.6 /100 | #187 | Fair 97.0% |
| Immigrants | Argentina | 30.4 /100 | #188 | Fair 97.0% |
| Blacks/African Americans | 30.2 /100 | #189 | Fair 97.0% |
| Dutch West Indians | 28.3 /100 | #190 | Fair 96.9% |
| Panamanians | 27.3 /100 | #191 | Fair 96.9% |
Demographics Similar to Whites/Caucasians by 6th Grade
In terms of 6th grade, the demographic groups most similar to Whites/Caucasians are Greek (97.7%, a difference of 0.0%), Austrian (97.7%, a difference of 0.010%), American (97.7%, a difference of 0.010%), Creek (97.7%, a difference of 0.020%), and Aleut (97.7%, a difference of 0.020%).
| Demographics | Rating | Rank | 6th Grade |
| Immigrants | Scotland | 99.8 /100 | #50 | Exceptional 97.8% |
| Maltese | 99.8 /100 | #51 | Exceptional 97.8% |
| Australians | 99.8 /100 | #52 | Exceptional 97.8% |
| Slavs | 99.8 /100 | #53 | Exceptional 97.8% |
| Creek | 99.8 /100 | #54 | Exceptional 97.7% |
| Aleuts | 99.8 /100 | #55 | Exceptional 97.7% |
| Austrians | 99.8 /100 | #56 | Exceptional 97.7% |
| Whites/Caucasians | 99.8 /100 | #57 | Exceptional 97.7% |
| Greeks | 99.8 /100 | #58 | Exceptional 97.7% |
| Americans | 99.8 /100 | #59 | Exceptional 97.7% |
| Immigrants | Canada | 99.8 /100 | #60 | Exceptional 97.7% |
| Serbians | 99.7 /100 | #61 | Exceptional 97.7% |
| Immigrants | North America | 99.7 /100 | #62 | Exceptional 97.7% |
| Russians | 99.7 /100 | #63 | Exceptional 97.7% |
| Canadians | 99.7 /100 | #64 | Exceptional 97.7% |