Immigrants from South Africa vs Lithuanian 1st Grade
COMPARE
Immigrants from South Africa
Lithuanian
1st Grade
1st Grade Comparison
Immigrants from South Africa
Lithuanians
98.3%
1ST GRADE
98.8/ 100
METRIC RATING
89th/ 347
METRIC RANK
98.6%
1ST GRADE
100.0/ 100
METRIC RATING
24th/ 347
METRIC RANK
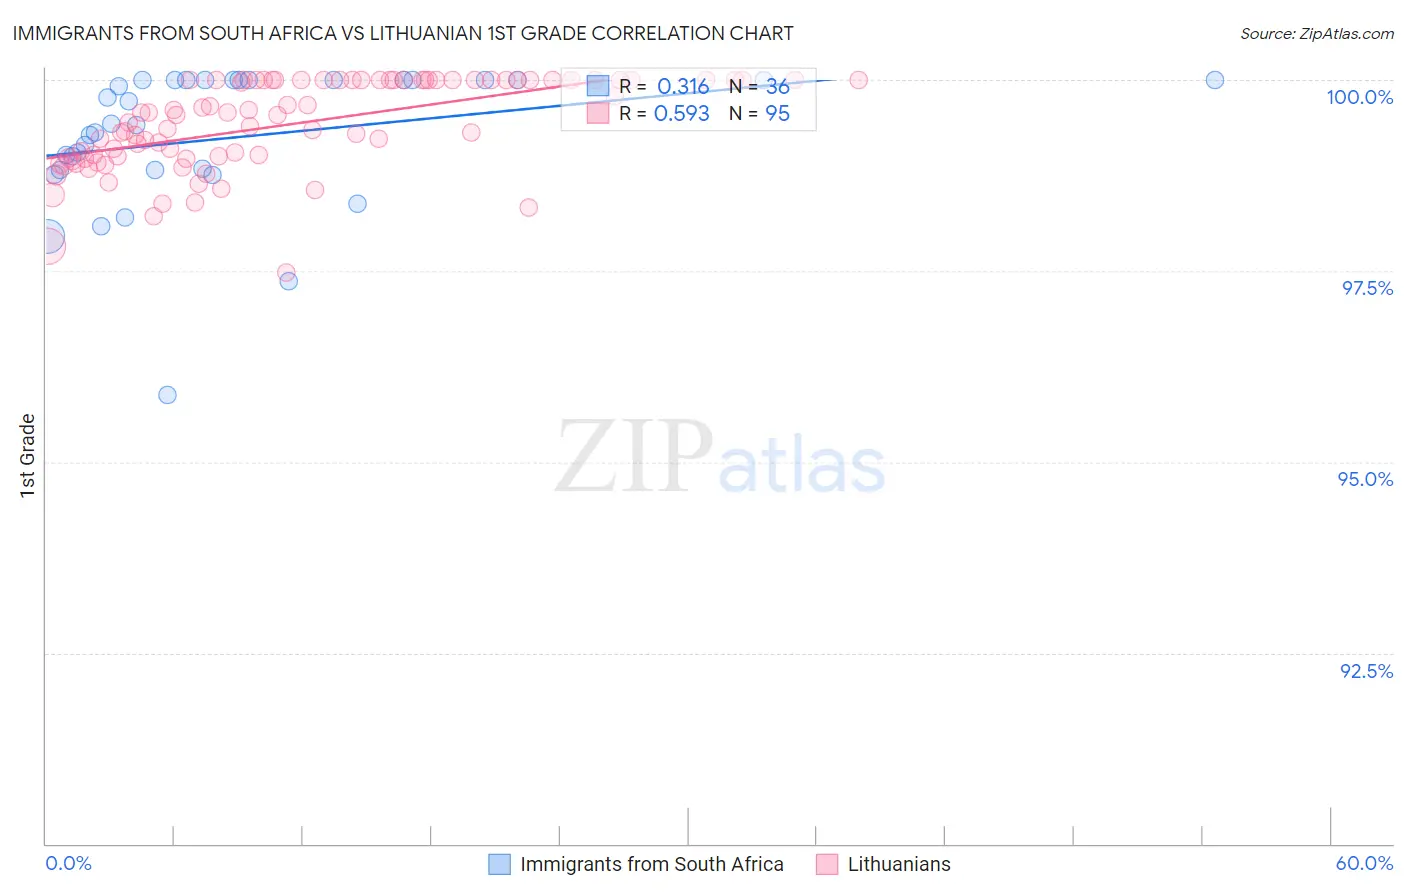
Immigrants from South Africa vs Lithuanian 1st Grade Correlation Chart
The statistical analysis conducted on geographies consisting of 233,321,693 people shows a mild positive correlation between the proportion of Immigrants from South Africa and percentage of population with at least 1st grade education in the United States with a correlation coefficient (R) of 0.316 and weighted average of 98.3%. Similarly, the statistical analysis conducted on geographies consisting of 421,946,231 people shows a substantial positive correlation between the proportion of Lithuanians and percentage of population with at least 1st grade education in the United States with a correlation coefficient (R) of 0.593 and weighted average of 98.6%, a difference of 0.33%.
1st Grade Correlation Summary
| Measurement | Immigrants from South Africa | Lithuanian |
| Minimum | 95.9% | 97.5% |
| Maximum | 100.0% | 100.0% |
| Range | 4.1% | 2.5% |
| Mean | 99.2% | 99.4% |
| Median | 99.4% | 99.5% |
| Interquartile 25% (IQ1) | 98.8% | 99.0% |
| Interquartile 75% (IQ3) | 100.0% | 100.0% |
| Interquartile Range (IQR) | 1.2% | 1.0% |
| Standard Deviation (Sample) | 0.92% | 0.59% |
| Standard Deviation (Population) | 0.91% | 0.59% |
Similar Demographics by 1st Grade
Demographics Similar to Immigrants from South Africa by 1st Grade
In terms of 1st grade, the demographic groups most similar to Immigrants from South Africa are Zimbabwean (98.3%, a difference of 0.0%), Ukrainian (98.3%, a difference of 0.0%), Immigrants from Western Europe (98.3%, a difference of 0.0%), Immigrants from Denmark (98.3%, a difference of 0.010%), and Immigrants from Australia (98.3%, a difference of 0.010%).
| Demographics | Rating | Rank | 1st Grade |
| Icelanders | 99.1 /100 | #82 | Exceptional 98.3% |
| Immigrants | Sweden | 99.1 /100 | #83 | Exceptional 98.3% |
| Delaware | 99.1 /100 | #84 | Exceptional 98.3% |
| Hopi | 99.0 /100 | #85 | Exceptional 98.3% |
| Immigrants | Denmark | 99.0 /100 | #86 | Exceptional 98.3% |
| Immigrants | Australia | 99.0 /100 | #87 | Exceptional 98.3% |
| Zimbabweans | 98.9 /100 | #88 | Exceptional 98.3% |
| Immigrants | South Africa | 98.8 /100 | #89 | Exceptional 98.3% |
| Ukrainians | 98.8 /100 | #90 | Exceptional 98.3% |
| Immigrants | Western Europe | 98.8 /100 | #91 | Exceptional 98.3% |
| Macedonians | 98.7 /100 | #92 | Exceptional 98.3% |
| Immigrants | India | 98.6 /100 | #93 | Exceptional 98.2% |
| South Africans | 98.6 /100 | #94 | Exceptional 98.2% |
| Immigrants | Germany | 98.5 /100 | #95 | Exceptional 98.2% |
| Cypriots | 98.3 /100 | #96 | Exceptional 98.2% |
Demographics Similar to Lithuanians by 1st Grade
In terms of 1st grade, the demographic groups most similar to Lithuanians are Sioux (98.6%, a difference of 0.0%), Arapaho (98.6%, a difference of 0.0%), Pennsylvania German (98.6%, a difference of 0.0%), Finnish (98.6%, a difference of 0.0%), and Danish (98.6%, a difference of 0.0%).
| Demographics | Rating | Rank | 1st Grade |
| Scottish | 100.0 /100 | #17 | Exceptional 98.6% |
| Dutch | 100.0 /100 | #18 | Exceptional 98.6% |
| Irish | 100.0 /100 | #19 | Exceptional 98.6% |
| Sioux | 100.0 /100 | #20 | Exceptional 98.6% |
| Arapaho | 100.0 /100 | #21 | Exceptional 98.6% |
| Pennsylvania Germans | 100.0 /100 | #22 | Exceptional 98.6% |
| Finns | 100.0 /100 | #23 | Exceptional 98.6% |
| Lithuanians | 100.0 /100 | #24 | Exceptional 98.6% |
| Danes | 100.0 /100 | #25 | Exceptional 98.6% |
| Scotch-Irish | 100.0 /100 | #26 | Exceptional 98.6% |
| Poles | 100.0 /100 | #27 | Exceptional 98.6% |
| Croatians | 100.0 /100 | #28 | Exceptional 98.6% |
| French | 100.0 /100 | #29 | Exceptional 98.6% |
| Europeans | 100.0 /100 | #30 | Exceptional 98.5% |
| Czechs | 100.0 /100 | #31 | Exceptional 98.5% |