Soviet Union vs Hungarian 5th Grade

COMPARE

Soviet Union
Race
Ancestry
AfghanAfricanAlaska NativeAlaskan AthabascanAlbanianAleutAlsatianAmericanApacheArabArapahoArgentineanArmenianAssyrian/Chaldean/SyriacAustralianAustrianBahamianBangladeshiBarbadianBasqueBelgianBelizeanBermudanBhutaneseBlackfeetBolivianBrazilianBritishBritish West IndianBulgarianBurmeseCajunCambodianCanadianCape VerdeanCarpatho RusynCelticCentral AmericanCentral American IndianCherokeeCheyenneChickasawChileanChineseChippewaChoctawColombianColvilleComancheCosta RicanCreeCreekCroatianCrowCubanCypriotCzechCzechoslovakianDanishDelawareDominicanDutchDutch West IndianEastern EuropeanEcuadorianEgyptianEnglishEstonianEthiopianEuropeanFijianFilipinoFinnishFrenchFrench American IndianFrench CanadianGermanGerman RussianGhanaianGreekGuamanian/ChamorroGuatemalanGuyaneseHaitianHmongHonduranHopiHoumaIcelanderIndian (Asian)IndonesianInupiatIranianIraqiIrishIroquoisIsraeliItalianJamaicanJapaneseJordanianKenyanKiowaKoreanLaotianLatvianLebaneseLiberianLithuanianLumbeeLuxembourgerMacedonianMalaysianMalteseMarshalleseMenomineeMexicanMexican American IndianMongolianMoroccanNative HawaiianNavajoNepaleseNew ZealanderNicaraguanNigerianNorthern EuropeanNorwegianOkinawanOsageOttawaPaiutePakistaniPalestinianPanamanianParaguayanPennsylvania GermanPeruvianPimaPolishPortuguesePotawatomiPuebloPuerto RicanPuget Sound SalishRomanianRussianSalvadoranSamoanScandinavianScotch-IrishScottishSeminoleSenegaleseSerbianShoshoneSierra LeoneanSiouxSlavicSlovakSloveneSomaliSouth AfricanSouth AmericanSouth American IndianSoviet UnionSpaniardSpanishSpanish AmericanSpanish American IndianSri LankanSubsaharan AfricanSudaneseSwedishSwissSyrianTaiwaneseThaiTlingit-HaidaTohono O'OdhamTonganTrinidadian and TobagonianTsimshianTurkishU.S. Virgin IslanderUgandanUkrainianUruguayanUteVenezuelanVietnameseWelshWest IndianYakamaYaquiYugoslavianYumanYup'ikZimbabwean
Immigration
NonimmigrantsImmigrantsAfghanistanAfricaAlbaniaArgentinaArmeniaAsiaAustraliaAustriaBahamasBangladeshBarbadosBelarusBelgiumBelizeBoliviaBosnia and HerzegovinaBrazilBulgariaBurma/MyanmarCabo VerdeCambodiaCameroonCanadaCaribbeanCentral AmericaChileChinaColombiaCongoCosta RicaCroatiaCubaCzechoslovakiaDenmarkDominicaDominican RepublicEastern AfricaEastern AsiaEastern EuropeEcuadorEgyptEl SalvadorEnglandEritreaEthiopiaEuropeFijiFranceGermanyGhanaGreeceGrenadaGuatemalaGuyanaHaitiHondurasHong KongHungaryIndiaIndonesiaIranIraqIrelandIsraelItalyJamaicaJapanJordanKazakhstanKenyaKoreaKuwaitLaosLatin AmericaLatviaLebanonLiberiaLithuaniaMalaysiaMexicoMicronesiaMiddle AfricaMoldovaMoroccoNepalNetherlandsNicaraguaNigeriaNorth AmericaNorth MacedoniaNorthern AfricaNorthern EuropeNorwayOceaniaPakistanPanamaPeruPhilippinesPolandPortugalRomaniaRussiaSaudi ArabiaScotlandSenegalSerbiaSierra LeoneSingaporeSomaliaSouth AfricaSouth AmericaSouth Central AsiaSouth Eastern AsiaSouthern EuropeSpainSri LankaSt. Vincent and the GrenadinesSudanSwedenSwitzerlandSyriaTaiwanThailandTrinidad and TobagoTurkeyUgandaUkraineUruguayUzbekistanVenezuelaVietnamWest IndiesWestern AfricaWestern AsiaWestern EuropeYemenZaireZimbabweAzores
Hungarian
Race
Ancestry
AfghanAfricanAlaska NativeAlaskan AthabascanAlbanianAleutAlsatianAmericanApacheArabArapahoArgentineanArmenianAssyrian/Chaldean/SyriacAustralianAustrianBahamianBangladeshiBarbadianBasqueBelgianBelizeanBermudanBhutaneseBlackfeetBolivianBrazilianBritishBritish West IndianBulgarianBurmeseCajunCambodianCanadianCape VerdeanCarpatho RusynCelticCentral AmericanCentral American IndianCherokeeCheyenneChickasawChileanChineseChippewaChoctawColombianColvilleComancheCosta RicanCreeCreekCroatianCrowCubanCypriotCzechCzechoslovakianDanishDelawareDominicanDutchDutch West IndianEastern EuropeanEcuadorianEgyptianEnglishEstonianEthiopianEuropeanFijianFilipinoFinnishFrenchFrench American IndianFrench CanadianGermanGerman RussianGhanaianGreekGuamanian/ChamorroGuatemalanGuyaneseHaitianHmongHonduranHopiHoumaHungarianIcelanderIndian (Asian)IndonesianInupiatIranianIraqiIrishIroquoisIsraeliItalianJamaicanJapaneseJordanianKenyanKiowaKoreanLaotianLatvianLebaneseLiberianLithuanianLumbeeLuxembourgerMacedonianMalaysianMalteseMarshalleseMenomineeMexicanMexican American IndianMongolianMoroccanNative HawaiianNavajoNepaleseNew ZealanderNicaraguanNigerianNorthern EuropeanNorwegianOkinawanOsageOttawaPaiutePakistaniPalestinianPanamanianParaguayanPennsylvania GermanPeruvianPimaPolishPortuguesePotawatomiPuebloPuerto RicanPuget Sound SalishRomanianRussianSalvadoranSamoanScandinavianScotch-IrishScottishSeminoleSenegaleseSerbianShoshoneSierra LeoneanSiouxSlavicSlovakSloveneSomaliSouth AfricanSouth AmericanSouth American IndianSpaniardSpanishSpanish AmericanSpanish American IndianSri LankanSubsaharan AfricanSudaneseSwedishSwissSyrianTaiwaneseThaiTlingit-HaidaTohono O'OdhamTonganTrinidadian and TobagonianTsimshianTurkishU.S. Virgin IslanderUgandanUkrainianUruguayanUteVenezuelanVietnameseWelshWest IndianYakamaYaquiYugoslavianYumanYup'ikZimbabwean
Immigration
NonimmigrantsImmigrantsAfghanistanAfricaAlbaniaArgentinaArmeniaAsiaAustraliaAustriaBahamasBangladeshBarbadosBelarusBelgiumBelizeBoliviaBosnia and HerzegovinaBrazilBulgariaBurma/MyanmarCabo VerdeCambodiaCameroonCanadaCaribbeanCentral AmericaChileChinaColombiaCongoCosta RicaCroatiaCubaCzechoslovakiaDenmarkDominicaDominican RepublicEastern AfricaEastern AsiaEastern EuropeEcuadorEgyptEl SalvadorEnglandEritreaEthiopiaEuropeFijiFranceGermanyGhanaGreeceGrenadaGuatemalaGuyanaHaitiHondurasHong KongHungaryIndiaIndonesiaIranIraqIrelandIsraelItalyJamaicaJapanJordanKazakhstanKenyaKoreaKuwaitLaosLatin AmericaLatviaLebanonLiberiaLithuaniaMalaysiaMexicoMicronesiaMiddle AfricaMoldovaMoroccoNepalNetherlandsNicaraguaNigeriaNorth AmericaNorth MacedoniaNorthern AfricaNorthern EuropeNorwayOceaniaPakistanPanamaPeruPhilippinesPolandPortugalRomaniaRussiaSaudi ArabiaScotlandSenegalSerbiaSierra LeoneSingaporeSomaliaSouth AfricaSouth AmericaSouth Central AsiaSouth Eastern AsiaSouthern EuropeSpainSri LankaSt. Vincent and the GrenadinesSudanSwedenSwitzerlandSyriaTaiwanThailandTrinidad and TobagoTurkeyUgandaUkraineUruguayUzbekistanVenezuelaVietnamWest IndiesWestern AfricaWestern AsiaWestern EuropeYemenZaireZimbabweAzores
5th Grade
Income
Poverty
Unemployment
Labor Participation
Family Structure
Vehicle Availability
Education Level
Disability

5th Grade Comparison

Soviet Union

Hungarians

Excellent
Exceptional
97.5%
5TH GRADE
81.2/ 100
METRIC RATING
147th/ 347
METRIC RANK
98.0%
5TH GRADE
99.9/ 100
METRIC RATING
41st/ 347
METRIC RANK

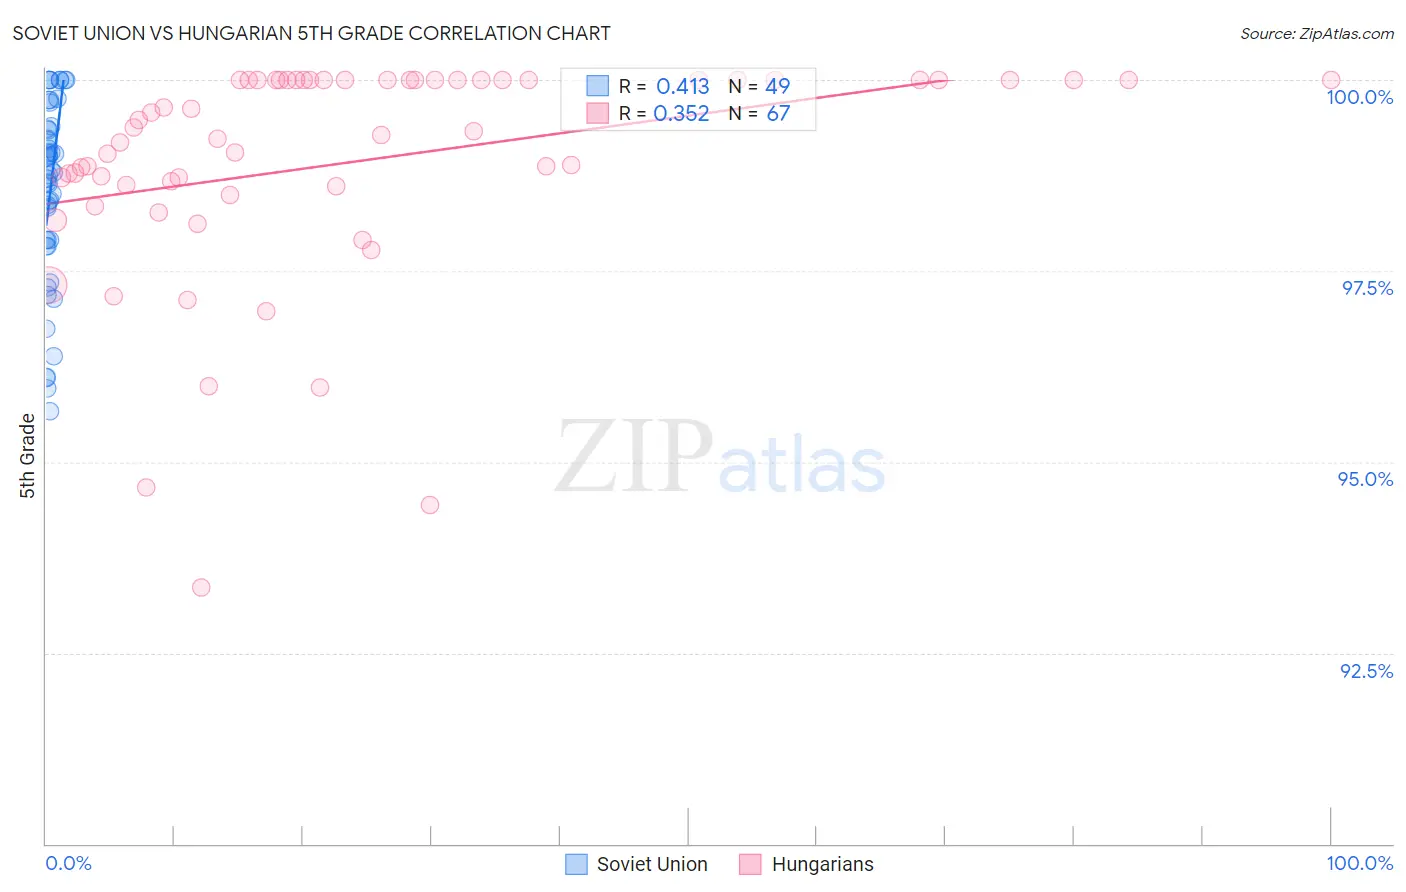
Soviet Union vs Hungarian 5th Grade Correlation Chart

The statistical analysis conducted on geographies consisting of 43,454,395 people shows a moderate positive correlation between the proportion of Soviet Union and percentage of population with at least 5th grade education in the United States with a correlation coefficient (R) of 0.413 and weighted average of 97.5%. Similarly, the statistical analysis conducted on geographies consisting of 486,239,314 people shows a mild positive correlation between the proportion of Hungarians and percentage of population with at least 5th grade education in the United States with a correlation coefficient (R) of 0.352 and weighted average of 98.0%, a difference of 0.58%.
Soviet Union vs Hungarian 5th Grade

5th Grade Correlation Summary

MeasurementSoviet UnionHungarian
Minimum95.7%93.3%
Maximum100.0%100.0%
Range4.3%6.7%
Mean98.5%98.9%
Median98.8%99.3%
Interquartile 25% (IQ1)97.9%98.6%
Interquartile 75% (IQ3)99.4%100.0%
Interquartile Range (IQR)1.5%1.4%
Standard Deviation (Sample)1.2%1.5%
Standard Deviation (Population)1.2%1.4%

Similar Demographics by 5th Grade

Demographics Similar to Soviet Union by 5th Grade

In terms of 5th grade, the demographic groups most similar to Soviet Union are Immigrants from Greece (97.5%, a difference of 0.010%), Jordanian (97.5%, a difference of 0.010%), Spaniard (97.5%, a difference of 0.010%), Immigrants from Israel (97.5%, a difference of 0.010%), and Hopi (97.5%, a difference of 0.020%).
DemographicsRating | Rank5th Grade
Burmese
86.1
/100
|
#140
Excellent
97.5%
Seminole
85.8
/100
|
#141
Excellent
97.5%
Israelis
85.5
/100
|
#142
Excellent
97.5%
Immigrants | North Macedonia
85.4
/100
|
#143
Excellent
97.5%
Immigrants | Greece
83.2
/100
|
#144
Excellent
97.5%
Jordanians
82.6
/100
|
#145
Excellent
97.5%
Spaniards
81.9
/100
|
#146
Excellent
97.5%
Soviet Union
81.2
/100
|
#147
Excellent
97.5%
Immigrants | Israel
79.1
/100
|
#148
Good
97.5%
Hopi
78.6
/100
|
#149
Good
97.5%
Immigrants | South Central Asia
78.6
/100
|
#150
Good
97.5%
Immigrants | Eastern Europe
75.0
/100
|
#151
Good
97.4%
Ute
74.9
/100
|
#152
Good
97.4%
Alsatians
74.3
/100
|
#153
Good
97.4%
Immigrants | Russia
71.2
/100
|
#154
Good
97.4%

Demographics Similar to Hungarians by 5th Grade

In terms of 5th grade, the demographic groups most similar to Hungarians are Northern European (98.0%, a difference of 0.010%), Eastern European (98.1%, a difference of 0.020%), Ottawa (98.0%, a difference of 0.020%), Luxembourger (98.1%, a difference of 0.030%), and Aleut (98.0%, a difference of 0.030%).
DemographicsRating | Rank5th Grade
Chinese
100.0
/100
|
#34
Exceptional
98.1%
Italians
100.0
/100
|
#35
Exceptional
98.1%
British
100.0
/100
|
#36
Exceptional
98.1%
Latvians
99.9
/100
|
#37
Exceptional
98.1%
Belgians
99.9
/100
|
#38
Exceptional
98.1%
Luxembourgers
99.9
/100
|
#39
Exceptional
98.1%
Eastern Europeans
99.9
/100
|
#40
Exceptional
98.1%
Hungarians
99.9
/100
|
#41
Exceptional
98.0%
Northern Europeans
99.9
/100
|
#42
Exceptional
98.0%
Ottawa
99.9
/100
|
#43
Exceptional
98.0%
Aleuts
99.9
/100
|
#44
Exceptional
98.0%
Czechoslovakians
99.9
/100
|
#45
Exceptional
98.0%
Arapaho
99.9
/100
|
#46
Exceptional
98.0%
Native Hawaiians
99.9
/100
|
#47
Exceptional
98.0%
Bulgarians
99.8
/100
|
#48
Exceptional
98.0%