South American vs Cambodian 2nd Grade
COMPARE
South American
Cambodian
2nd Grade
2nd Grade Comparison
South Americans
Cambodians
97.5%
2ND GRADE
0.9/ 100
METRIC RATING
246th/ 347
METRIC RANK
98.0%
2ND GRADE
90.7/ 100
METRIC RATING
133rd/ 347
METRIC RANK
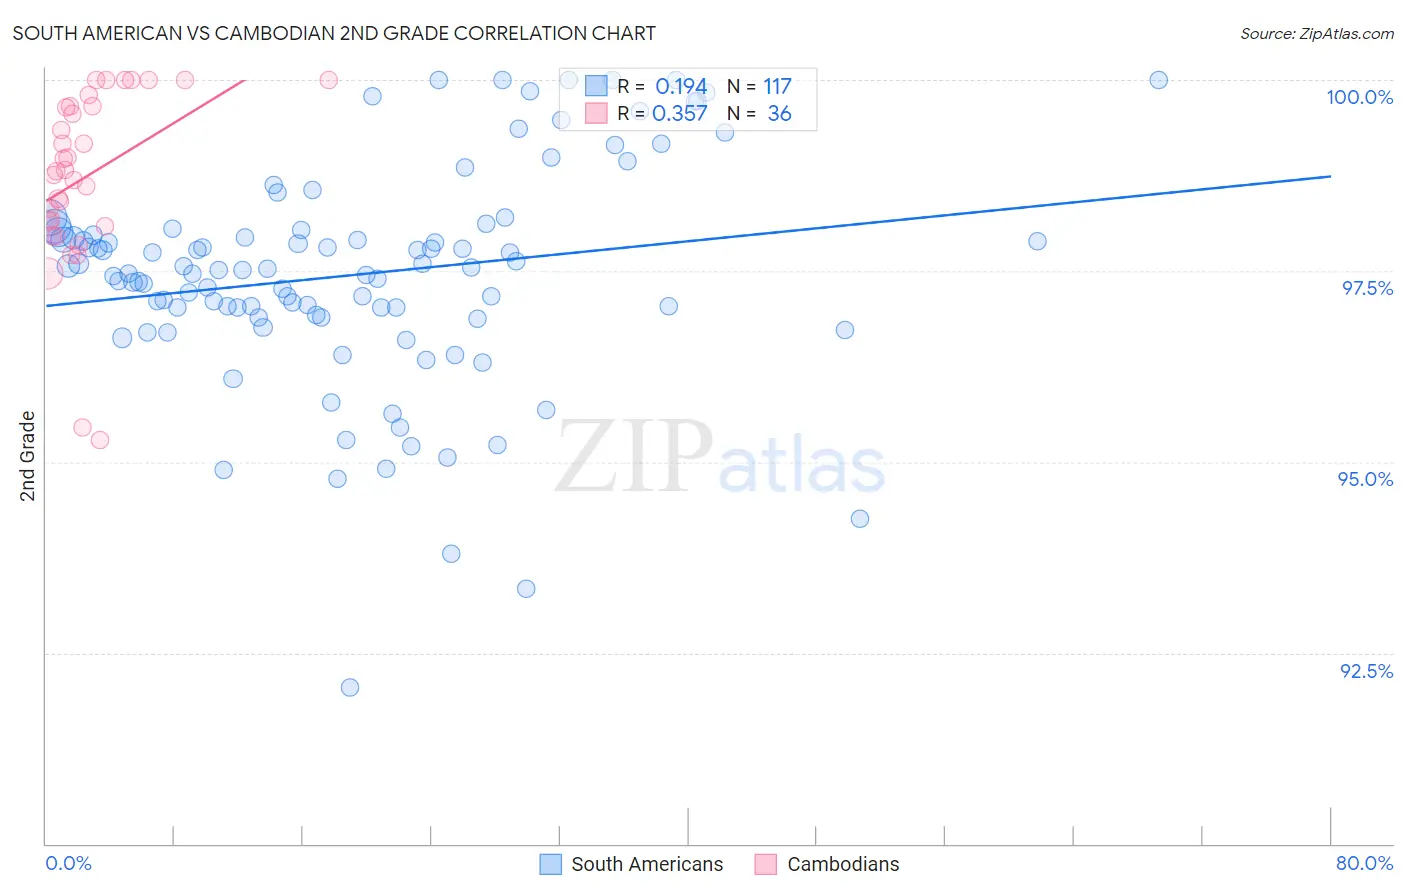
South American vs Cambodian 2nd Grade Correlation Chart
The statistical analysis conducted on geographies consisting of 494,178,447 people shows a poor positive correlation between the proportion of South Americans and percentage of population with at least 2nd grade education in the United States with a correlation coefficient (R) of 0.194 and weighted average of 97.5%. Similarly, the statistical analysis conducted on geographies consisting of 102,511,743 people shows a mild positive correlation between the proportion of Cambodians and percentage of population with at least 2nd grade education in the United States with a correlation coefficient (R) of 0.357 and weighted average of 98.0%, a difference of 0.55%.
2nd Grade Correlation Summary
| Measurement | South American | Cambodian |
| Minimum | 92.1% | 95.3% |
| Maximum | 100.0% | 100.0% |
| Range | 7.9% | 4.7% |
| Mean | 97.5% | 98.7% |
| Median | 97.5% | 98.8% |
| Interquartile 25% (IQ1) | 96.9% | 98.1% |
| Interquartile 75% (IQ3) | 98.0% | 99.7% |
| Interquartile Range (IQR) | 1.1% | 1.5% |
| Standard Deviation (Sample) | 1.4% | 1.2% |
| Standard Deviation (Population) | 1.4% | 1.1% |
Similar Demographics by 2nd Grade
Demographics Similar to South Americans by 2nd Grade
In terms of 2nd grade, the demographic groups most similar to South Americans are Immigrants from Eastern Africa (97.5%, a difference of 0.0%), Immigrants from Senegal (97.5%, a difference of 0.0%), Immigrants from Middle Africa (97.5%, a difference of 0.0%), Bolivian (97.5%, a difference of 0.0%), and Immigrants from Iraq (97.5%, a difference of 0.010%).
| Demographics | Rating | Rank | 2nd Grade |
| Liberians | 1.6 /100 | #239 | Tragic 97.6% |
| Koreans | 1.5 /100 | #240 | Tragic 97.5% |
| Ethiopians | 1.2 /100 | #241 | Tragic 97.5% |
| Immigrants | Indonesia | 1.2 /100 | #242 | Tragic 97.5% |
| Asians | 1.1 /100 | #243 | Tragic 97.5% |
| Immigrants | Iraq | 1.0 /100 | #244 | Tragic 97.5% |
| Immigrants | Eastern Africa | 0.9 /100 | #245 | Tragic 97.5% |
| South Americans | 0.9 /100 | #246 | Tragic 97.5% |
| Immigrants | Senegal | 0.9 /100 | #247 | Tragic 97.5% |
| Immigrants | Middle Africa | 0.9 /100 | #248 | Tragic 97.5% |
| Bolivians | 0.9 /100 | #249 | Tragic 97.5% |
| Peruvians | 0.9 /100 | #250 | Tragic 97.5% |
| Immigrants | Africa | 0.8 /100 | #251 | Tragic 97.5% |
| Immigrants | Asia | 0.7 /100 | #252 | Tragic 97.5% |
| Puerto Ricans | 0.7 /100 | #253 | Tragic 97.5% |
Demographics Similar to Cambodians by 2nd Grade
In terms of 2nd grade, the demographic groups most similar to Cambodians are Seminole (98.0%, a difference of 0.0%), Immigrants from Europe (98.0%, a difference of 0.0%), Spaniard (98.0%, a difference of 0.0%), Immigrants from Croatia (98.1%, a difference of 0.010%), and Immigrants from Hungary (98.0%, a difference of 0.010%).
| Demographics | Rating | Rank | 2nd Grade |
| Syrians | 94.0 /100 | #126 | Exceptional 98.1% |
| Immigrants | Saudi Arabia | 93.6 /100 | #127 | Exceptional 98.1% |
| Immigrants | Serbia | 92.3 /100 | #128 | Exceptional 98.1% |
| Immigrants | Croatia | 92.1 /100 | #129 | Exceptional 98.1% |
| Seminole | 91.1 /100 | #130 | Exceptional 98.0% |
| Immigrants | Europe | 91.1 /100 | #131 | Exceptional 98.0% |
| Spaniards | 90.7 /100 | #132 | Exceptional 98.0% |
| Cambodians | 90.7 /100 | #133 | Exceptional 98.0% |
| Immigrants | Hungary | 89.7 /100 | #134 | Excellent 98.0% |
| Immigrants | Bulgaria | 89.7 /100 | #135 | Excellent 98.0% |
| Immigrants | Kuwait | 89.2 /100 | #136 | Excellent 98.0% |
| Immigrants | Romania | 88.3 /100 | #137 | Excellent 98.0% |
| Israelis | 87.9 /100 | #138 | Excellent 98.0% |
| Blackfeet | 87.5 /100 | #139 | Excellent 98.0% |
| Palestinians | 83.9 /100 | #140 | Excellent 98.0% |