South American Indian vs Zimbabwean 1st Grade
COMPARE
South American Indian
Zimbabwean
1st Grade
1st Grade Comparison
South American Indians
Zimbabweans
97.7%
1ST GRADE
7.6/ 100
METRIC RATING
214th/ 347
METRIC RANK
98.3%
1ST GRADE
98.9/ 100
METRIC RATING
88th/ 347
METRIC RANK
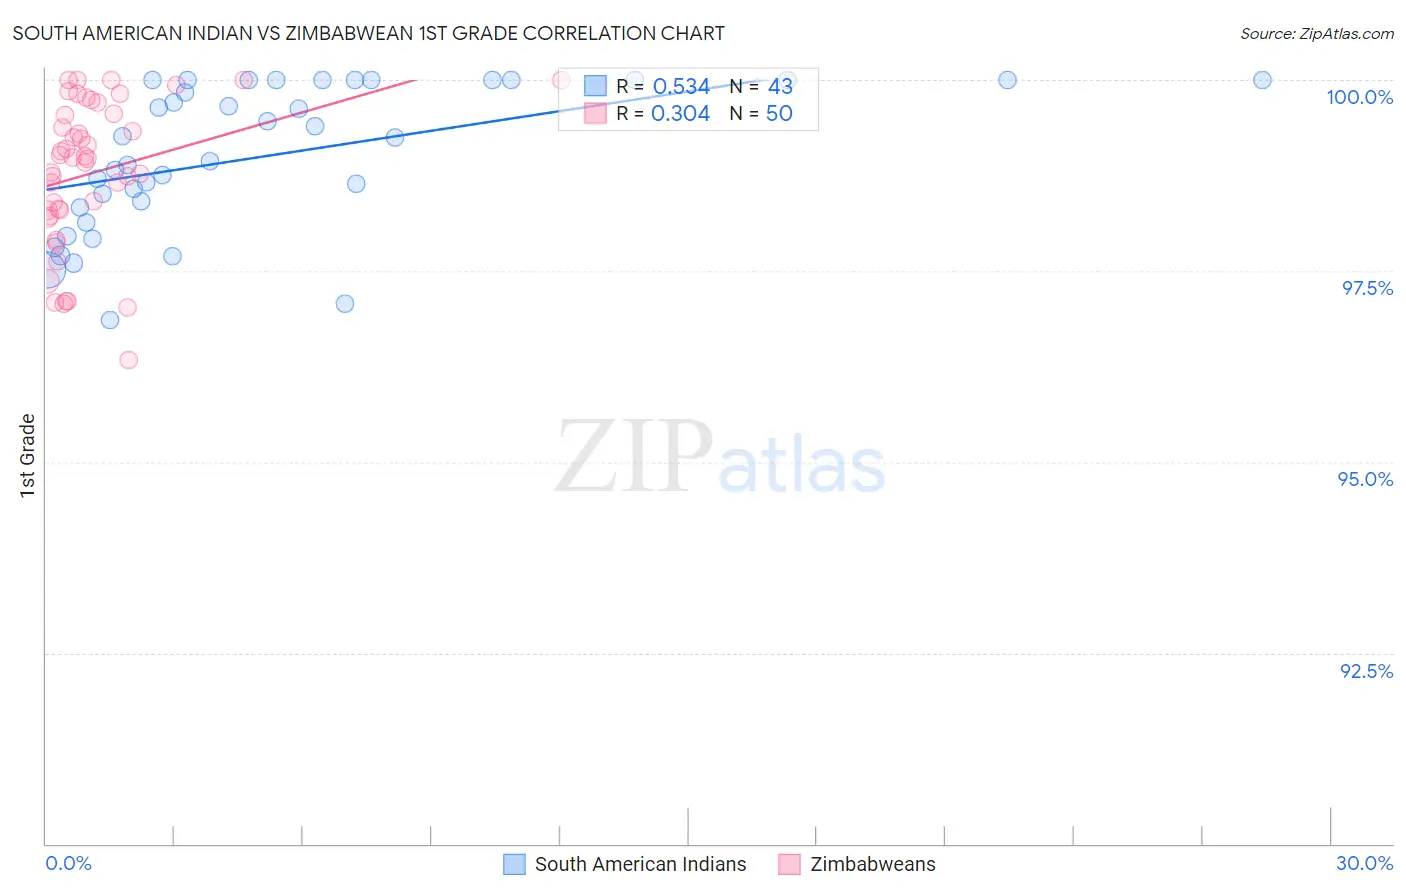
South American Indian vs Zimbabwean 1st Grade Correlation Chart
The statistical analysis conducted on geographies consisting of 164,573,401 people shows a substantial positive correlation between the proportion of South American Indians and percentage of population with at least 1st grade education in the United States with a correlation coefficient (R) of 0.534 and weighted average of 97.7%. Similarly, the statistical analysis conducted on geographies consisting of 69,200,462 people shows a mild positive correlation between the proportion of Zimbabweans and percentage of population with at least 1st grade education in the United States with a correlation coefficient (R) of 0.304 and weighted average of 98.3%, a difference of 0.54%.
1st Grade Correlation Summary
| Measurement | South American Indian | Zimbabwean |
| Minimum | 96.9% | 96.3% |
| Maximum | 100.0% | 100.0% |
| Range | 3.1% | 3.7% |
| Mean | 99.0% | 98.8% |
| Median | 99.2% | 99.0% |
| Interquartile 25% (IQ1) | 98.3% | 98.3% |
| Interquartile 75% (IQ3) | 100.0% | 99.6% |
| Interquartile Range (IQR) | 1.7% | 1.3% |
| Standard Deviation (Sample) | 0.95% | 0.96% |
| Standard Deviation (Population) | 0.94% | 0.95% |
Similar Demographics by 1st Grade
Demographics Similar to South American Indians by 1st Grade
In terms of 1st grade, the demographic groups most similar to South American Indians are Bahamian (97.7%, a difference of 0.0%), Uruguayan (97.7%, a difference of 0.0%), Moroccan (97.7%, a difference of 0.010%), Immigrants from Bahamas (97.7%, a difference of 0.010%), and Samoan (97.7%, a difference of 0.010%).
| Demographics | Rating | Rank | 1st Grade |
| Africans | 16.5 /100 | #207 | Poor 97.8% |
| Immigrants | Northern Africa | 12.0 /100 | #208 | Poor 97.8% |
| Costa Ricans | 11.6 /100 | #209 | Poor 97.8% |
| Immigrants | Oceania | 11.0 /100 | #210 | Poor 97.8% |
| Laotians | 10.3 /100 | #211 | Poor 97.8% |
| Moroccans | 8.7 /100 | #212 | Tragic 97.7% |
| Immigrants | Bahamas | 8.1 /100 | #213 | Tragic 97.7% |
| South American Indians | 7.6 /100 | #214 | Tragic 97.7% |
| Bahamians | 7.5 /100 | #215 | Tragic 97.7% |
| Uruguayans | 7.4 /100 | #216 | Tragic 97.7% |
| Samoans | 6.8 /100 | #217 | Tragic 97.7% |
| Immigrants | Morocco | 5.3 /100 | #218 | Tragic 97.7% |
| Immigrants | Panama | 5.2 /100 | #219 | Tragic 97.7% |
| Tongans | 4.6 /100 | #220 | Tragic 97.7% |
| Immigrants | Sudan | 4.3 /100 | #221 | Tragic 97.7% |
Demographics Similar to Zimbabweans by 1st Grade
In terms of 1st grade, the demographic groups most similar to Zimbabweans are Immigrants from South Africa (98.3%, a difference of 0.0%), Ukrainian (98.3%, a difference of 0.0%), Immigrants from Sweden (98.3%, a difference of 0.010%), Delaware (98.3%, a difference of 0.010%), and Hopi (98.3%, a difference of 0.010%).
| Demographics | Rating | Rank | 1st Grade |
| Potawatomi | 99.1 /100 | #81 | Exceptional 98.3% |
| Icelanders | 99.1 /100 | #82 | Exceptional 98.3% |
| Immigrants | Sweden | 99.1 /100 | #83 | Exceptional 98.3% |
| Delaware | 99.1 /100 | #84 | Exceptional 98.3% |
| Hopi | 99.0 /100 | #85 | Exceptional 98.3% |
| Immigrants | Denmark | 99.0 /100 | #86 | Exceptional 98.3% |
| Immigrants | Australia | 99.0 /100 | #87 | Exceptional 98.3% |
| Zimbabweans | 98.9 /100 | #88 | Exceptional 98.3% |
| Immigrants | South Africa | 98.8 /100 | #89 | Exceptional 98.3% |
| Ukrainians | 98.8 /100 | #90 | Exceptional 98.3% |
| Immigrants | Western Europe | 98.8 /100 | #91 | Exceptional 98.3% |
| Macedonians | 98.7 /100 | #92 | Exceptional 98.3% |
| Immigrants | India | 98.6 /100 | #93 | Exceptional 98.2% |
| South Africans | 98.6 /100 | #94 | Exceptional 98.2% |
| Immigrants | Germany | 98.5 /100 | #95 | Exceptional 98.2% |