Immigrants from Israel vs Zimbabwean 1st Grade
COMPARE
Immigrants from Israel
Zimbabwean
1st Grade
1st Grade Comparison
Immigrants from Israel
Zimbabweans
98.0%
1ST GRADE
77.8/ 100
METRIC RATING
146th/ 347
METRIC RANK
98.3%
1ST GRADE
98.9/ 100
METRIC RATING
88th/ 347
METRIC RANK
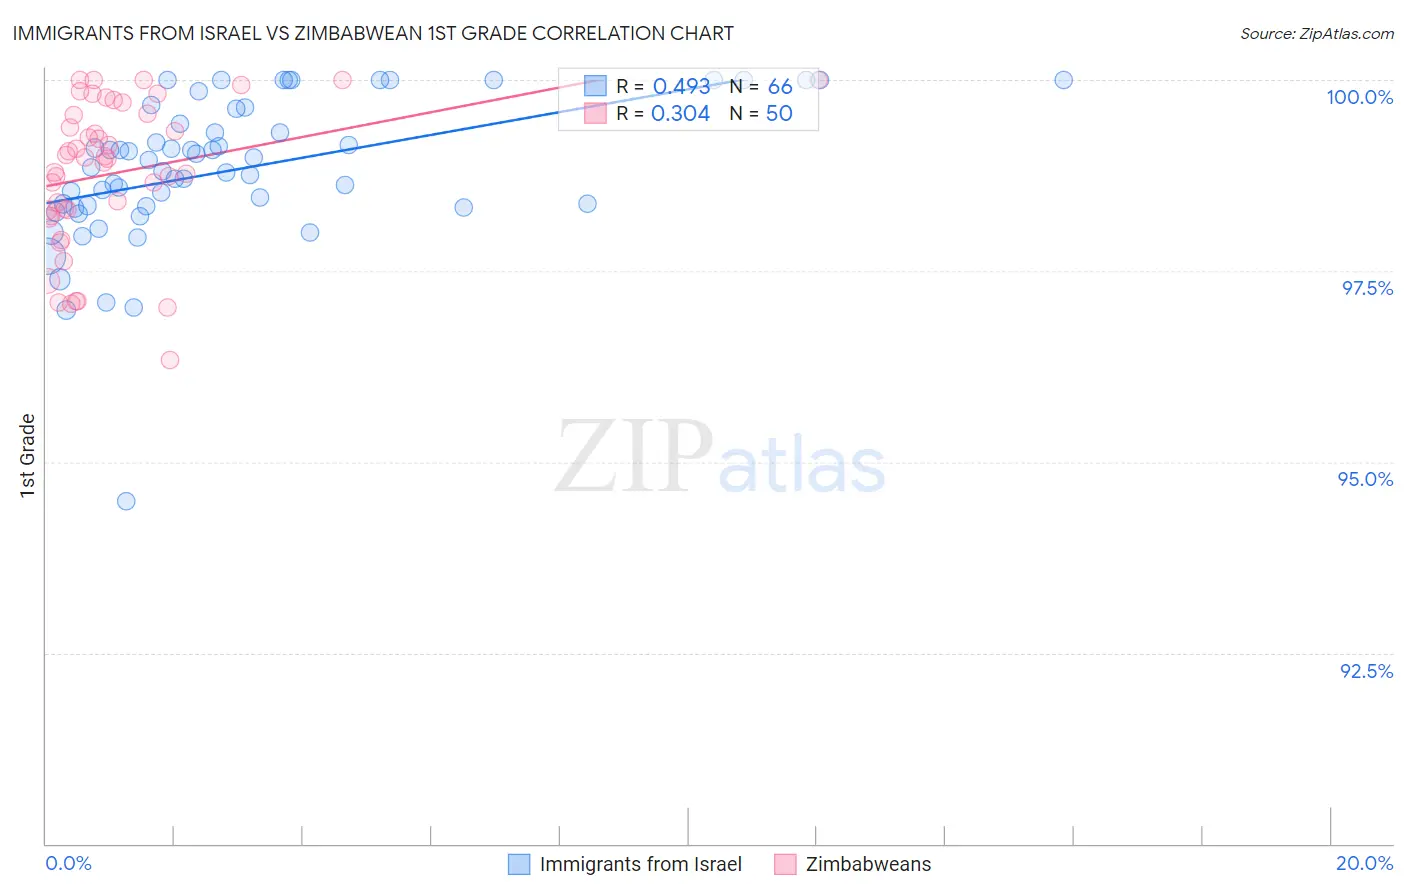
Immigrants from Israel vs Zimbabwean 1st Grade Correlation Chart
The statistical analysis conducted on geographies consisting of 210,029,773 people shows a moderate positive correlation between the proportion of Immigrants from Israel and percentage of population with at least 1st grade education in the United States with a correlation coefficient (R) of 0.493 and weighted average of 98.0%. Similarly, the statistical analysis conducted on geographies consisting of 69,200,462 people shows a mild positive correlation between the proportion of Zimbabweans and percentage of population with at least 1st grade education in the United States with a correlation coefficient (R) of 0.304 and weighted average of 98.3%, a difference of 0.25%.
1st Grade Correlation Summary
| Measurement | Immigrants from Israel | Zimbabwean |
| Minimum | 94.5% | 96.3% |
| Maximum | 100.0% | 100.0% |
| Range | 5.5% | 3.7% |
| Mean | 98.8% | 98.8% |
| Median | 98.9% | 99.0% |
| Interquartile 25% (IQ1) | 98.4% | 98.3% |
| Interquartile 75% (IQ3) | 99.6% | 99.6% |
| Interquartile Range (IQR) | 1.3% | 1.3% |
| Standard Deviation (Sample) | 0.97% | 0.96% |
| Standard Deviation (Population) | 0.96% | 0.95% |
Similar Demographics by 1st Grade
Demographics Similar to Immigrants from Israel by 1st Grade
In terms of 1st grade, the demographic groups most similar to Immigrants from Israel are Filipino (98.0%, a difference of 0.0%), Burmese (98.0%, a difference of 0.010%), Alsatian (98.0%, a difference of 0.010%), Hmong (98.0%, a difference of 0.010%), and Apache (98.0%, a difference of 0.010%).
| Demographics | Rating | Rank | 1st Grade |
| Blackfeet | 87.6 /100 | #139 | Excellent 98.1% |
| Palestinians | 83.0 /100 | #140 | Excellent 98.0% |
| Immigrants | Turkey | 82.8 /100 | #141 | Excellent 98.0% |
| Marshallese | 82.0 /100 | #142 | Excellent 98.0% |
| Burmese | 81.0 /100 | #143 | Excellent 98.0% |
| Alsatians | 80.9 /100 | #144 | Excellent 98.0% |
| Hmong | 79.0 /100 | #145 | Good 98.0% |
| Immigrants | Israel | 77.8 /100 | #146 | Good 98.0% |
| Filipinos | 77.6 /100 | #147 | Good 98.0% |
| Apache | 75.2 /100 | #148 | Good 98.0% |
| Immigrants | Greece | 74.9 /100 | #149 | Good 98.0% |
| Jordanians | 72.7 /100 | #150 | Good 98.0% |
| Dutch West Indians | 69.8 /100 | #151 | Good 98.0% |
| Immigrants | Moldova | 69.5 /100 | #152 | Good 98.0% |
| Soviet Union | 68.9 /100 | #153 | Good 98.0% |
Demographics Similar to Zimbabweans by 1st Grade
In terms of 1st grade, the demographic groups most similar to Zimbabweans are Immigrants from South Africa (98.3%, a difference of 0.0%), Ukrainian (98.3%, a difference of 0.0%), Immigrants from Sweden (98.3%, a difference of 0.010%), Delaware (98.3%, a difference of 0.010%), and Hopi (98.3%, a difference of 0.010%).
| Demographics | Rating | Rank | 1st Grade |
| Potawatomi | 99.1 /100 | #81 | Exceptional 98.3% |
| Icelanders | 99.1 /100 | #82 | Exceptional 98.3% |
| Immigrants | Sweden | 99.1 /100 | #83 | Exceptional 98.3% |
| Delaware | 99.1 /100 | #84 | Exceptional 98.3% |
| Hopi | 99.0 /100 | #85 | Exceptional 98.3% |
| Immigrants | Denmark | 99.0 /100 | #86 | Exceptional 98.3% |
| Immigrants | Australia | 99.0 /100 | #87 | Exceptional 98.3% |
| Zimbabweans | 98.9 /100 | #88 | Exceptional 98.3% |
| Immigrants | South Africa | 98.8 /100 | #89 | Exceptional 98.3% |
| Ukrainians | 98.8 /100 | #90 | Exceptional 98.3% |
| Immigrants | Western Europe | 98.8 /100 | #91 | Exceptional 98.3% |
| Macedonians | 98.7 /100 | #92 | Exceptional 98.3% |
| Immigrants | India | 98.6 /100 | #93 | Exceptional 98.2% |
| South Africans | 98.6 /100 | #94 | Exceptional 98.2% |
| Immigrants | Germany | 98.5 /100 | #95 | Exceptional 98.2% |