South American Indian vs Israeli High School Diploma
COMPARE
South American Indian
Israeli
High School Diploma
High School Diploma Comparison
South American Indians
Israelis
88.5%
HIGH SCHOOL DIPLOMA
12.2/ 100
METRIC RATING
212th/ 347
METRIC RANK
90.1%
HIGH SCHOOL DIPLOMA
95.1/ 100
METRIC RATING
118th/ 347
METRIC RANK
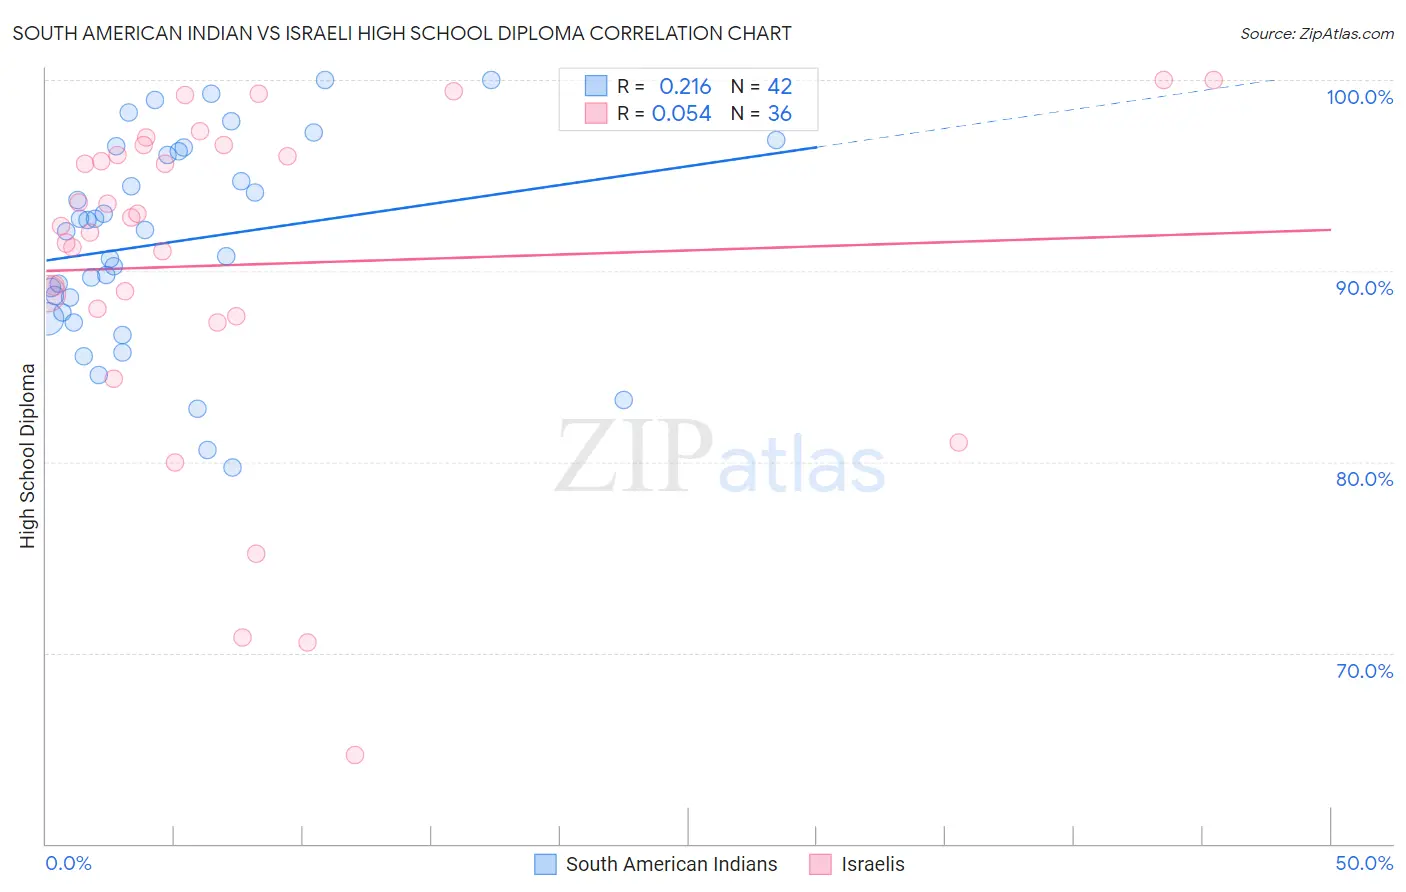
South American Indian vs Israeli High School Diploma Correlation Chart
The statistical analysis conducted on geographies consisting of 164,573,088 people shows a weak positive correlation between the proportion of South American Indians and percentage of population with at least high school diploma education in the United States with a correlation coefficient (R) of 0.216 and weighted average of 88.5%. Similarly, the statistical analysis conducted on geographies consisting of 211,220,500 people shows a slight positive correlation between the proportion of Israelis and percentage of population with at least high school diploma education in the United States with a correlation coefficient (R) of 0.054 and weighted average of 90.1%, a difference of 1.9%.
High School Diploma Correlation Summary
| Measurement | South American Indian | Israeli |
| Minimum | 79.7% | 64.7% |
| Maximum | 100.0% | 100.0% |
| Range | 20.3% | 35.3% |
| Mean | 91.5% | 90.3% |
| Median | 92.1% | 92.6% |
| Interquartile 25% (IQ1) | 87.8% | 87.8% |
| Interquartile 75% (IQ3) | 96.3% | 96.3% |
| Interquartile Range (IQR) | 8.5% | 8.5% |
| Standard Deviation (Sample) | 5.3% | 8.8% |
| Standard Deviation (Population) | 5.3% | 8.7% |
Similar Demographics by High School Diploma
Demographics Similar to South American Indians by High School Diploma
In terms of high school diploma, the demographic groups most similar to South American Indians are Inupiat (88.5%, a difference of 0.030%), Immigrants from Somalia (88.4%, a difference of 0.040%), Immigrants from Cameroon (88.4%, a difference of 0.050%), Crow (88.4%, a difference of 0.050%), and Samoan (88.5%, a difference of 0.060%).
| Demographics | Rating | Rank | High School Diploma |
| Immigrants | Micronesia | 16.4 /100 | #205 | Poor 88.6% |
| Arapaho | 16.1 /100 | #206 | Poor 88.6% |
| Immigrants | Sierra Leone | 15.8 /100 | #207 | Poor 88.6% |
| Portuguese | 14.4 /100 | #208 | Poor 88.5% |
| Cherokee | 14.3 /100 | #209 | Poor 88.5% |
| Samoans | 14.0 /100 | #210 | Poor 88.5% |
| Inupiat | 13.1 /100 | #211 | Poor 88.5% |
| South American Indians | 12.2 /100 | #212 | Poor 88.5% |
| Immigrants | Somalia | 11.3 /100 | #213 | Poor 88.4% |
| Immigrants | Cameroon | 10.9 /100 | #214 | Poor 88.4% |
| Crow | 10.9 /100 | #215 | Poor 88.4% |
| Chickasaw | 10.7 /100 | #216 | Poor 88.4% |
| Immigrants | Africa | 10.6 /100 | #217 | Poor 88.4% |
| Immigrants | Bolivia | 10.3 /100 | #218 | Poor 88.4% |
| Costa Ricans | 9.6 /100 | #219 | Tragic 88.4% |
Demographics Similar to Israelis by High School Diploma
In terms of high school diploma, the demographic groups most similar to Israelis are Jordanian (90.2%, a difference of 0.020%), Immigrants from Eastern Europe (90.1%, a difference of 0.020%), Immigrants from Germany (90.2%, a difference of 0.050%), Ottawa (90.1%, a difference of 0.050%), and Immigrants from Hungary (90.2%, a difference of 0.060%).
| Demographics | Rating | Rank | High School Diploma |
| Menominee | 96.6 /100 | #111 | Exceptional 90.3% |
| Immigrants | Belarus | 96.4 /100 | #112 | Exceptional 90.2% |
| Immigrants | Sri Lanka | 96.3 /100 | #113 | Exceptional 90.2% |
| Yugoslavians | 96.2 /100 | #114 | Exceptional 90.2% |
| Immigrants | Hungary | 95.8 /100 | #115 | Exceptional 90.2% |
| Immigrants | Germany | 95.7 /100 | #116 | Exceptional 90.2% |
| Jordanians | 95.4 /100 | #117 | Exceptional 90.2% |
| Israelis | 95.1 /100 | #118 | Exceptional 90.1% |
| Immigrants | Eastern Europe | 94.9 /100 | #119 | Exceptional 90.1% |
| Ottawa | 94.4 /100 | #120 | Exceptional 90.1% |
| Whites/Caucasians | 94.1 /100 | #121 | Exceptional 90.1% |
| Immigrants | Kazakhstan | 93.4 /100 | #122 | Exceptional 90.0% |
| German Russians | 92.0 /100 | #123 | Exceptional 90.0% |
| Mongolians | 91.6 /100 | #124 | Exceptional 89.9% |
| Egyptians | 91.1 /100 | #125 | Exceptional 89.9% |