Immigrants from Moldova vs Israeli High School Diploma
COMPARE
Immigrants from Moldova
Israeli
High School Diploma
High School Diploma Comparison
Immigrants from Moldova
Israelis
90.7%
HIGH SCHOOL DIPLOMA
99.2/ 100
METRIC RATING
83rd/ 347
METRIC RANK
90.1%
HIGH SCHOOL DIPLOMA
95.1/ 100
METRIC RATING
118th/ 347
METRIC RANK
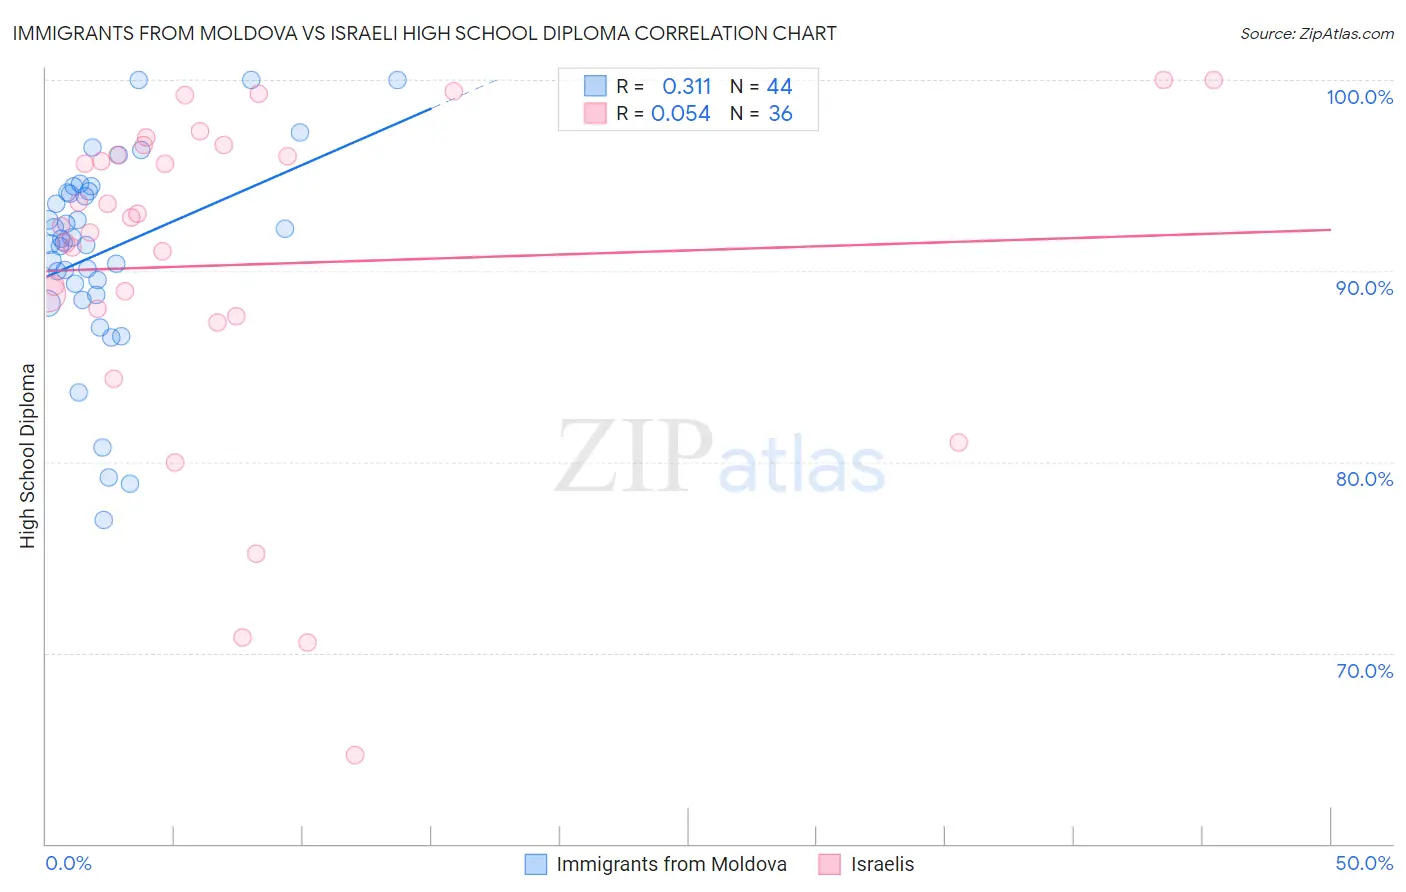
Immigrants from Moldova vs Israeli High School Diploma Correlation Chart
The statistical analysis conducted on geographies consisting of 124,401,069 people shows a mild positive correlation between the proportion of Immigrants from Moldova and percentage of population with at least high school diploma education in the United States with a correlation coefficient (R) of 0.311 and weighted average of 90.7%. Similarly, the statistical analysis conducted on geographies consisting of 211,220,500 people shows a slight positive correlation between the proportion of Israelis and percentage of population with at least high school diploma education in the United States with a correlation coefficient (R) of 0.054 and weighted average of 90.1%, a difference of 0.68%.
High School Diploma Correlation Summary
| Measurement | Immigrants from Moldova | Israeli |
| Minimum | 77.0% | 64.7% |
| Maximum | 100.0% | 100.0% |
| Range | 23.0% | 35.3% |
| Mean | 91.0% | 90.3% |
| Median | 91.6% | 92.6% |
| Interquartile 25% (IQ1) | 89.0% | 87.8% |
| Interquartile 75% (IQ3) | 94.2% | 96.3% |
| Interquartile Range (IQR) | 5.1% | 8.5% |
| Standard Deviation (Sample) | 5.3% | 8.8% |
| Standard Deviation (Population) | 5.2% | 8.7% |
Similar Demographics by High School Diploma
Demographics Similar to Immigrants from Moldova by High School Diploma
In terms of high school diploma, the demographic groups most similar to Immigrants from Moldova are Scotch-Irish (90.8%, a difference of 0.020%), Immigrants from Saudi Arabia (90.7%, a difference of 0.030%), Immigrants from Switzerland (90.8%, a difference of 0.050%), Immigrants from England (90.8%, a difference of 0.060%), and Immigrants from Denmark (90.8%, a difference of 0.070%).
| Demographics | Rating | Rank | High School Diploma |
| Hungarians | 99.3 /100 | #76 | Exceptional 90.8% |
| Native Hawaiians | 99.3 /100 | #77 | Exceptional 90.8% |
| Burmese | 99.3 /100 | #78 | Exceptional 90.8% |
| Immigrants | Denmark | 99.3 /100 | #79 | Exceptional 90.8% |
| Immigrants | England | 99.3 /100 | #80 | Exceptional 90.8% |
| Immigrants | Switzerland | 99.3 /100 | #81 | Exceptional 90.8% |
| Scotch-Irish | 99.2 /100 | #82 | Exceptional 90.8% |
| Immigrants | Moldova | 99.2 /100 | #83 | Exceptional 90.7% |
| Immigrants | Saudi Arabia | 99.1 /100 | #84 | Exceptional 90.7% |
| Romanians | 98.9 /100 | #85 | Exceptional 90.7% |
| Immigrants | Bulgaria | 98.9 /100 | #86 | Exceptional 90.6% |
| Immigrants | Turkey | 98.9 /100 | #87 | Exceptional 90.6% |
| Immigrants | France | 98.8 /100 | #88 | Exceptional 90.6% |
| Canadians | 98.7 /100 | #89 | Exceptional 90.6% |
| Celtics | 98.7 /100 | #90 | Exceptional 90.6% |
Demographics Similar to Israelis by High School Diploma
In terms of high school diploma, the demographic groups most similar to Israelis are Jordanian (90.2%, a difference of 0.020%), Immigrants from Eastern Europe (90.1%, a difference of 0.020%), Immigrants from Germany (90.2%, a difference of 0.050%), Ottawa (90.1%, a difference of 0.050%), and Immigrants from Hungary (90.2%, a difference of 0.060%).
| Demographics | Rating | Rank | High School Diploma |
| Menominee | 96.6 /100 | #111 | Exceptional 90.3% |
| Immigrants | Belarus | 96.4 /100 | #112 | Exceptional 90.2% |
| Immigrants | Sri Lanka | 96.3 /100 | #113 | Exceptional 90.2% |
| Yugoslavians | 96.2 /100 | #114 | Exceptional 90.2% |
| Immigrants | Hungary | 95.8 /100 | #115 | Exceptional 90.2% |
| Immigrants | Germany | 95.7 /100 | #116 | Exceptional 90.2% |
| Jordanians | 95.4 /100 | #117 | Exceptional 90.2% |
| Israelis | 95.1 /100 | #118 | Exceptional 90.1% |
| Immigrants | Eastern Europe | 94.9 /100 | #119 | Exceptional 90.1% |
| Ottawa | 94.4 /100 | #120 | Exceptional 90.1% |
| Whites/Caucasians | 94.1 /100 | #121 | Exceptional 90.1% |
| Immigrants | Kazakhstan | 93.4 /100 | #122 | Exceptional 90.0% |
| German Russians | 92.0 /100 | #123 | Exceptional 90.0% |
| Mongolians | 91.6 /100 | #124 | Exceptional 89.9% |
| Egyptians | 91.1 /100 | #125 | Exceptional 89.9% |