South American Indian vs Immigrants from Sri Lanka Unemployment Among Ages 25 to 29 years
COMPARE
South American Indian
Immigrants from Sri Lanka
Unemployment Among Ages 25 to 29 years
Unemployment Among Ages 25 to 29 years Comparison
South American Indians
Immigrants from Sri Lanka
6.8%
UNEMPLOYMENT AMONG AGES 25 TO 29 YEARS
23.3/ 100
METRIC RATING
200th/ 347
METRIC RANK
6.3%
UNEMPLOYMENT AMONG AGES 25 TO 29 YEARS
97.9/ 100
METRIC RATING
64th/ 347
METRIC RANK
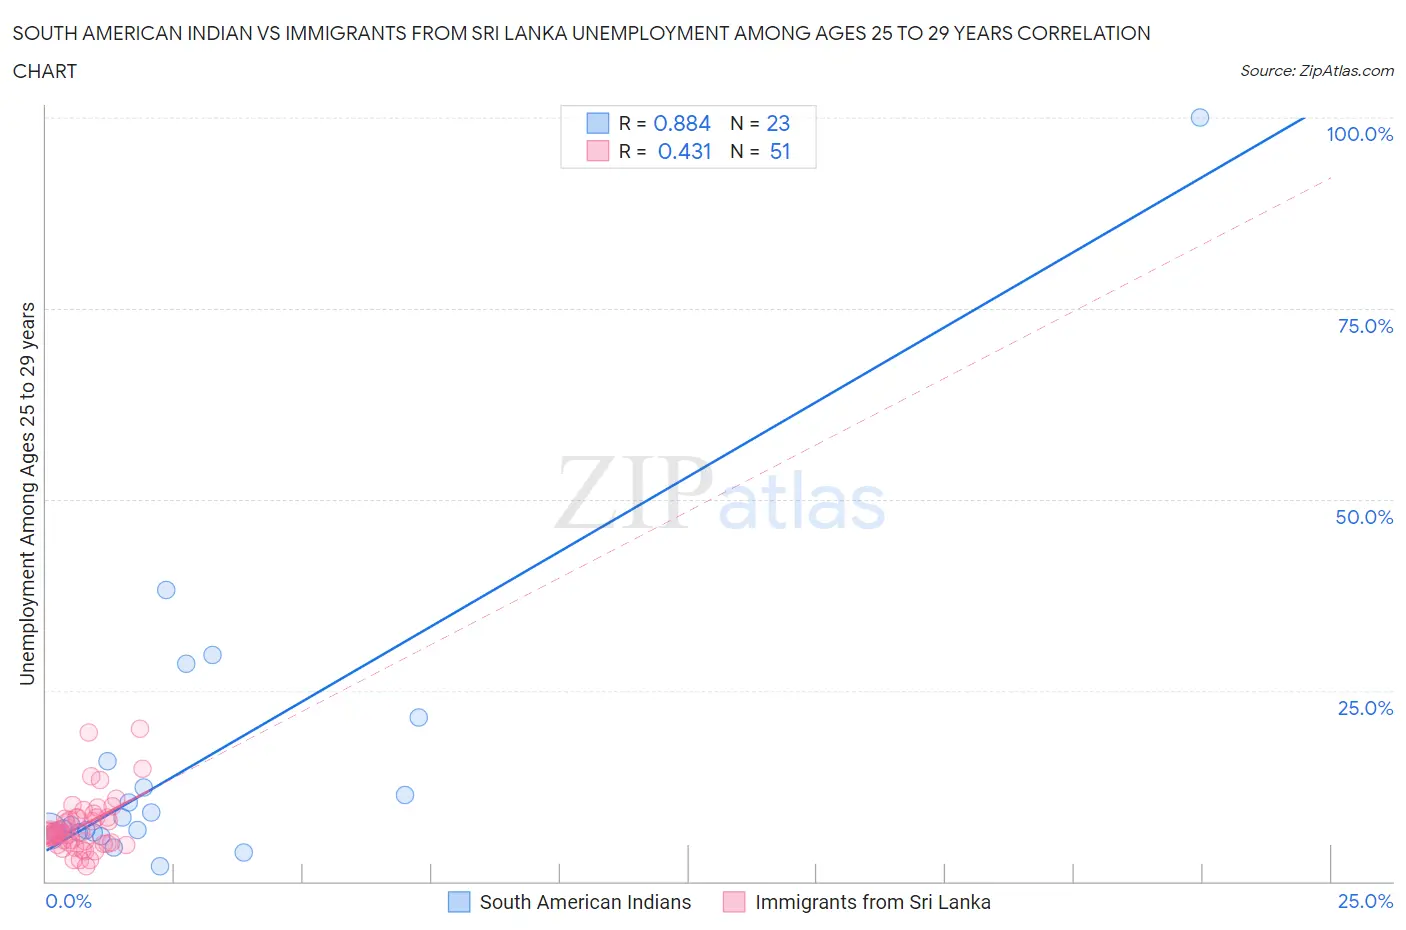
South American Indian vs Immigrants from Sri Lanka Unemployment Among Ages 25 to 29 years Correlation Chart
The statistical analysis conducted on geographies consisting of 162,011,391 people shows a very strong positive correlation between the proportion of South American Indians and unemployment rate among population between the ages 25 and 29 in the United States with a correlation coefficient (R) of 0.884 and weighted average of 6.8%. Similarly, the statistical analysis conducted on geographies consisting of 147,259,052 people shows a moderate positive correlation between the proportion of Immigrants from Sri Lanka and unemployment rate among population between the ages 25 and 29 in the United States with a correlation coefficient (R) of 0.431 and weighted average of 6.3%, a difference of 8.2%.
Unemployment Among Ages 25 to 29 years Correlation Summary
| Measurement | South American Indian | Immigrants from Sri Lanka |
| Minimum | 2.0% | 1.9% |
| Maximum | 100.0% | 20.0% |
| Range | 98.0% | 18.1% |
| Mean | 15.4% | 7.3% |
| Median | 7.4% | 6.3% |
| Interquartile 25% (IQ1) | 6.4% | 4.9% |
| Interquartile 75% (IQ3) | 15.7% | 8.4% |
| Interquartile Range (IQR) | 9.3% | 3.5% |
| Standard Deviation (Sample) | 20.6% | 3.7% |
| Standard Deviation (Population) | 20.2% | 3.7% |
Similar Demographics by Unemployment Among Ages 25 to 29 years
Demographics Similar to South American Indians by Unemployment Among Ages 25 to 29 years
In terms of unemployment among ages 25 to 29 years, the demographic groups most similar to South American Indians are Basque (6.8%, a difference of 0.070%), Guamanian/Chamorro (6.8%, a difference of 0.080%), Immigrants from Southern Europe (6.8%, a difference of 0.10%), Immigrants from Argentina (6.8%, a difference of 0.15%), and Immigrants from Norway (6.8%, a difference of 0.18%).
| Demographics | Rating | Rank | Unemployment Among Ages 25 to 29 years |
| Alsatians | 28.1 /100 | #193 | Fair 6.7% |
| Immigrants | Greece | 28.0 /100 | #194 | Fair 6.7% |
| Immigrants | Western Asia | 27.3 /100 | #195 | Fair 6.7% |
| Hungarians | 26.8 /100 | #196 | Fair 6.8% |
| Italians | 26.5 /100 | #197 | Fair 6.8% |
| Immigrants | Southern Europe | 24.6 /100 | #198 | Fair 6.8% |
| Guamanians/Chamorros | 24.3 /100 | #199 | Fair 6.8% |
| South American Indians | 23.3 /100 | #200 | Fair 6.8% |
| Basques | 22.5 /100 | #201 | Fair 6.8% |
| Immigrants | Argentina | 21.6 /100 | #202 | Fair 6.8% |
| Immigrants | Norway | 21.2 /100 | #203 | Fair 6.8% |
| Scotch-Irish | 20.0 /100 | #204 | Poor 6.8% |
| Immigrants | England | 19.8 /100 | #205 | Poor 6.8% |
| Ugandans | 19.8 /100 | #206 | Poor 6.8% |
| Immigrants | Denmark | 19.0 /100 | #207 | Poor 6.8% |
Demographics Similar to Immigrants from Sri Lanka by Unemployment Among Ages 25 to 29 years
In terms of unemployment among ages 25 to 29 years, the demographic groups most similar to Immigrants from Sri Lanka are Kenyan (6.3%, a difference of 0.050%), Immigrants from Lebanon (6.3%, a difference of 0.060%), Indian (Asian) (6.3%, a difference of 0.070%), Immigrants from Northern Africa (6.3%, a difference of 0.080%), and Immigrants from China (6.2%, a difference of 0.12%).
| Demographics | Rating | Rank | Unemployment Among Ages 25 to 29 years |
| Immigrants | Saudi Arabia | 98.6 /100 | #57 | Exceptional 6.2% |
| Immigrants | Eastern Asia | 98.4 /100 | #58 | Exceptional 6.2% |
| Luxembourgers | 98.3 /100 | #59 | Exceptional 6.2% |
| Immigrants | Taiwan | 98.3 /100 | #60 | Exceptional 6.2% |
| Bhutanese | 98.2 /100 | #61 | Exceptional 6.2% |
| Immigrants | China | 98.1 /100 | #62 | Exceptional 6.2% |
| Kenyans | 98.0 /100 | #63 | Exceptional 6.3% |
| Immigrants | Sri Lanka | 97.9 /100 | #64 | Exceptional 6.3% |
| Immigrants | Lebanon | 97.8 /100 | #65 | Exceptional 6.3% |
| Indians (Asian) | 97.8 /100 | #66 | Exceptional 6.3% |
| Immigrants | Northern Africa | 97.8 /100 | #67 | Exceptional 6.3% |
| Palestinians | 97.7 /100 | #68 | Exceptional 6.3% |
| Immigrants | Hong Kong | 97.5 /100 | #69 | Exceptional 6.3% |
| Immigrants | Malaysia | 97.5 /100 | #70 | Exceptional 6.3% |
| Immigrants | France | 97.4 /100 | #71 | Exceptional 6.3% |