European vs Immigrants from Asia 6th Grade
COMPARE
European
Immigrants from Asia
6th Grade
6th Grade Comparison
Europeans
Immigrants from Asia
98.0%
6TH GRADE
100.0/ 100
METRIC RATING
31st/ 347
METRIC RANK
96.6%
6TH GRADE
1.8/ 100
METRIC RATING
242nd/ 347
METRIC RANK
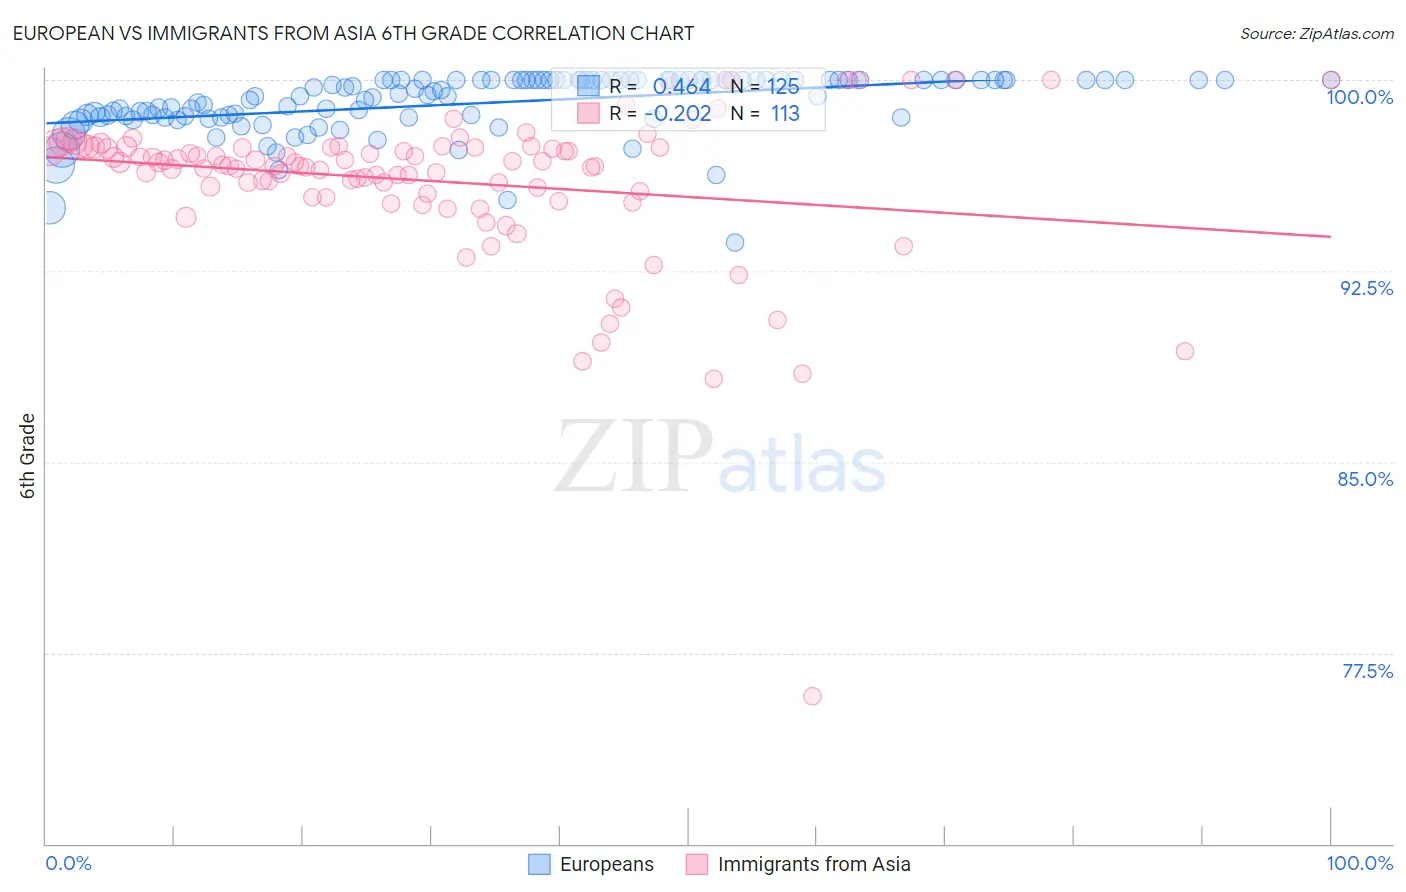
European vs Immigrants from Asia 6th Grade Correlation Chart
The statistical analysis conducted on geographies consisting of 561,829,544 people shows a moderate positive correlation between the proportion of Europeans and percentage of population with at least 6th grade education in the United States with a correlation coefficient (R) of 0.464 and weighted average of 98.0%. Similarly, the statistical analysis conducted on geographies consisting of 549,170,438 people shows a weak negative correlation between the proportion of Immigrants from Asia and percentage of population with at least 6th grade education in the United States with a correlation coefficient (R) of -0.202 and weighted average of 96.6%, a difference of 1.4%.
6th Grade Correlation Summary
| Measurement | European | Immigrants from Asia |
| Minimum | 93.6% | 75.8% |
| Maximum | 100.0% | 100.0% |
| Range | 6.4% | 24.2% |
| Mean | 99.1% | 96.0% |
| Median | 99.5% | 96.8% |
| Interquartile 25% (IQ1) | 98.5% | 95.6% |
| Interquartile 75% (IQ3) | 100.0% | 97.4% |
| Interquartile Range (IQR) | 1.5% | 1.8% |
| Standard Deviation (Sample) | 1.2% | 3.1% |
| Standard Deviation (Population) | 1.2% | 3.1% |
Similar Demographics by 6th Grade
Demographics Similar to Europeans by 6th Grade
In terms of 6th grade, the demographic groups most similar to Europeans are French Canadian (98.0%, a difference of 0.0%), Scandinavian (98.0%, a difference of 0.010%), French (98.0%, a difference of 0.010%), Alaska Native (98.0%, a difference of 0.010%), and Czech (98.0%, a difference of 0.020%).
| Demographics | Rating | Rank | 6th Grade |
| Croatians | 100.0 /100 | #24 | Exceptional 98.0% |
| Scotch-Irish | 100.0 /100 | #25 | Exceptional 98.0% |
| Czechs | 100.0 /100 | #26 | Exceptional 98.0% |
| Yup'ik | 100.0 /100 | #27 | Exceptional 98.0% |
| Scandinavians | 100.0 /100 | #28 | Exceptional 98.0% |
| French | 100.0 /100 | #29 | Exceptional 98.0% |
| French Canadians | 100.0 /100 | #30 | Exceptional 98.0% |
| Europeans | 100.0 /100 | #31 | Exceptional 98.0% |
| Alaska Natives | 100.0 /100 | #32 | Exceptional 98.0% |
| Chippewa | 100.0 /100 | #33 | Exceptional 97.9% |
| Swiss | 100.0 /100 | #34 | Exceptional 97.9% |
| Chinese | 100.0 /100 | #35 | Exceptional 97.9% |
| Italians | 100.0 /100 | #36 | Exceptional 97.9% |
| British | 100.0 /100 | #37 | Exceptional 97.9% |
| Belgians | 100.0 /100 | #38 | Exceptional 97.9% |
Demographics Similar to Immigrants from Asia by 6th Grade
In terms of 6th grade, the demographic groups most similar to Immigrants from Asia are Senegalese (96.6%, a difference of 0.0%), Nigerian (96.6%, a difference of 0.010%), Indian (Asian) (96.6%, a difference of 0.010%), Korean (96.6%, a difference of 0.010%), and Immigrants from Liberia (96.6%, a difference of 0.010%).
| Demographics | Rating | Rank | 6th Grade |
| Asians | 2.4 /100 | #235 | Tragic 96.6% |
| Immigrants | Indonesia | 2.3 /100 | #236 | Tragic 96.6% |
| Immigrants | Eastern Africa | 2.0 /100 | #237 | Tragic 96.6% |
| Nigerians | 1.9 /100 | #238 | Tragic 96.6% |
| Indians (Asian) | 1.9 /100 | #239 | Tragic 96.6% |
| Koreans | 1.9 /100 | #240 | Tragic 96.6% |
| Senegalese | 1.8 /100 | #241 | Tragic 96.6% |
| Immigrants | Asia | 1.8 /100 | #242 | Tragic 96.6% |
| Immigrants | Liberia | 1.6 /100 | #243 | Tragic 96.6% |
| Ethiopians | 1.5 /100 | #244 | Tragic 96.6% |
| Immigrants | Costa Rica | 1.3 /100 | #245 | Tragic 96.6% |
| Immigrants | Africa | 1.3 /100 | #246 | Tragic 96.6% |
| Bolivians | 1.0 /100 | #247 | Tragic 96.5% |
| Tohono O'odham | 1.0 /100 | #248 | Tragic 96.5% |
| Colombians | 0.9 /100 | #249 | Tragic 96.5% |