Bahamian vs Houma 8th Grade
COMPARE
Bahamian
Houma
8th Grade
8th Grade Comparison
Bahamians
Houma
95.3%
8TH GRADE
5.6/ 100
METRIC RATING
227th/ 347
METRIC RANK
94.2%
8TH GRADE
0.0/ 100
METRIC RATING
294th/ 347
METRIC RANK
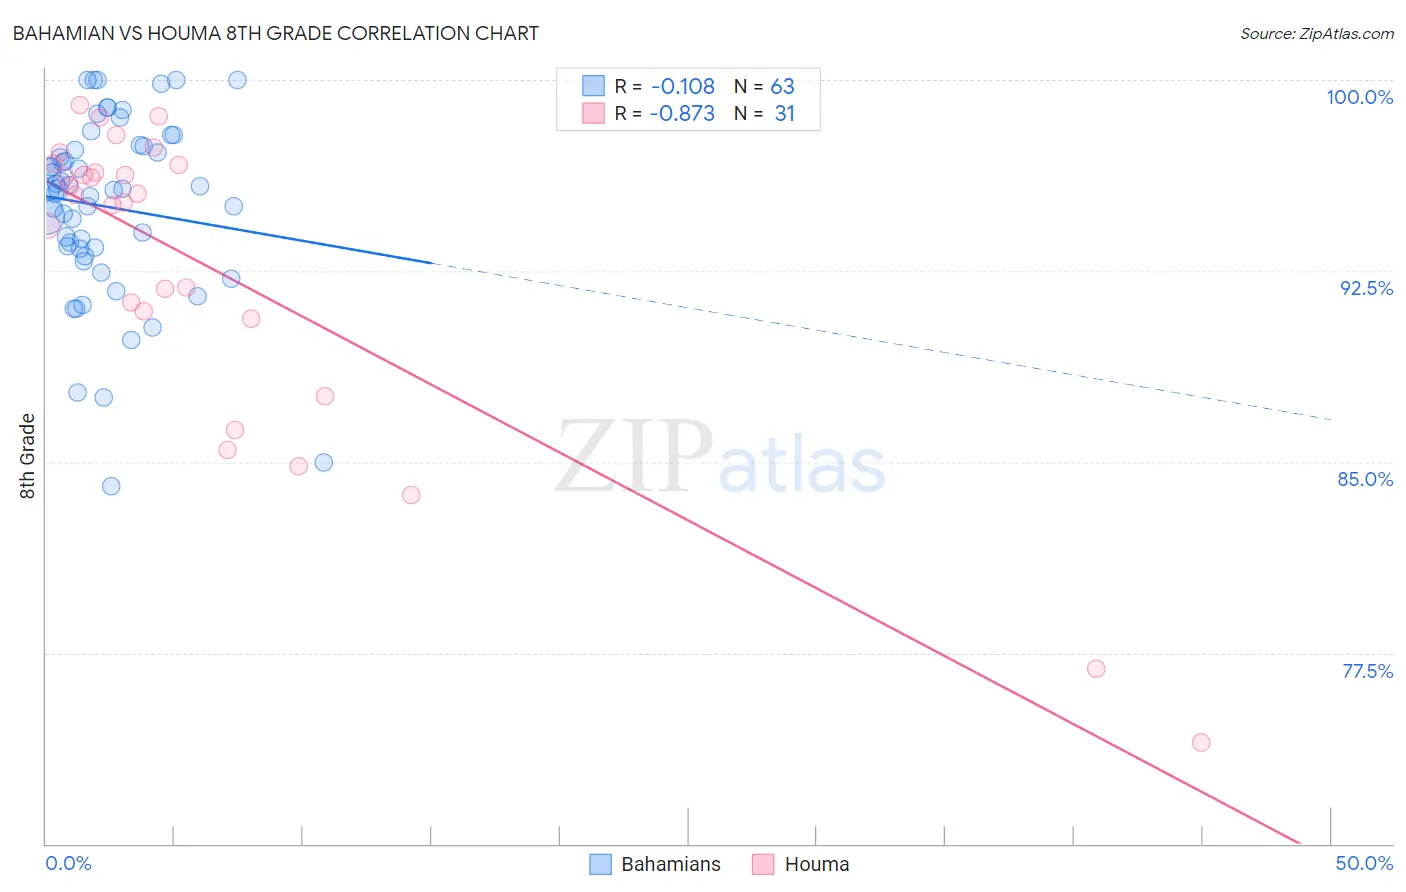
Bahamian vs Houma 8th Grade Correlation Chart
The statistical analysis conducted on geographies consisting of 112,698,819 people shows a poor negative correlation between the proportion of Bahamians and percentage of population with at least 8th grade education in the United States with a correlation coefficient (R) of -0.108 and weighted average of 95.3%. Similarly, the statistical analysis conducted on geographies consisting of 36,795,916 people shows a very strong negative correlation between the proportion of Houma and percentage of population with at least 8th grade education in the United States with a correlation coefficient (R) of -0.873 and weighted average of 94.2%, a difference of 1.1%.
8th Grade Correlation Summary
| Measurement | Bahamian | Houma |
| Minimum | 84.0% | 74.0% |
| Maximum | 100.0% | 99.0% |
| Range | 16.0% | 25.0% |
| Mean | 95.0% | 92.6% |
| Median | 95.7% | 95.5% |
| Interquartile 25% (IQ1) | 93.4% | 90.6% |
| Interquartile 75% (IQ3) | 97.4% | 96.7% |
| Interquartile Range (IQR) | 4.0% | 6.0% |
| Standard Deviation (Sample) | 3.5% | 6.3% |
| Standard Deviation (Population) | 3.5% | 6.2% |
Similar Demographics by 8th Grade
Demographics Similar to Bahamians by 8th Grade
In terms of 8th grade, the demographic groups most similar to Bahamians are Navajo (95.3%, a difference of 0.0%), Immigrants from Eastern Africa (95.3%, a difference of 0.0%), Immigrants from Western Asia (95.3%, a difference of 0.010%), Subsaharan African (95.3%, a difference of 0.010%), and Immigrants from Oceania (95.3%, a difference of 0.040%).
| Demographics | Rating | Rank | 8th Grade |
| Immigrants | Southern Europe | 7.7 /100 | #220 | Tragic 95.3% |
| Immigrants | Syria | 7.4 /100 | #221 | Tragic 95.3% |
| Immigrants | Malaysia | 7.3 /100 | #222 | Tragic 95.3% |
| Immigrants | Oceania | 7.1 /100 | #223 | Tragic 95.3% |
| Immigrants | Western Asia | 6.0 /100 | #224 | Tragic 95.3% |
| Sub-Saharan Africans | 6.0 /100 | #225 | Tragic 95.3% |
| Navajo | 5.7 /100 | #226 | Tragic 95.3% |
| Bahamians | 5.6 /100 | #227 | Tragic 95.3% |
| Immigrants | Eastern Africa | 5.6 /100 | #228 | Tragic 95.3% |
| Immigrants | Indonesia | 4.4 /100 | #229 | Tragic 95.3% |
| Immigrants | Panama | 4.1 /100 | #230 | Tragic 95.2% |
| Asians | 3.5 /100 | #231 | Tragic 95.2% |
| Indians (Asian) | 3.3 /100 | #232 | Tragic 95.2% |
| Immigrants | Asia | 3.1 /100 | #233 | Tragic 95.2% |
| Costa Ricans | 3.0 /100 | #234 | Tragic 95.2% |
Demographics Similar to Houma by 8th Grade
In terms of 8th grade, the demographic groups most similar to Houma are Yaqui (94.2%, a difference of 0.0%), Fijian (94.2%, a difference of 0.010%), Bangladeshi (94.3%, a difference of 0.030%), Haitian (94.2%, a difference of 0.030%), and Immigrants from South Eastern Asia (94.2%, a difference of 0.040%).
| Demographics | Rating | Rank | 8th Grade |
| Tohono O'odham | 0.0 /100 | #287 | Tragic 94.5% |
| Malaysians | 0.0 /100 | #288 | Tragic 94.5% |
| British West Indians | 0.0 /100 | #289 | Tragic 94.4% |
| Immigrants | West Indies | 0.0 /100 | #290 | Tragic 94.3% |
| Immigrants | Grenada | 0.0 /100 | #291 | Tragic 94.3% |
| Bangladeshis | 0.0 /100 | #292 | Tragic 94.3% |
| Yaqui | 0.0 /100 | #293 | Tragic 94.2% |
| Houma | 0.0 /100 | #294 | Tragic 94.2% |
| Fijians | 0.0 /100 | #295 | Tragic 94.2% |
| Haitians | 0.0 /100 | #296 | Tragic 94.2% |
| Immigrants | South Eastern Asia | 0.0 /100 | #297 | Tragic 94.2% |
| Indonesians | 0.0 /100 | #298 | Tragic 94.1% |
| Cubans | 0.0 /100 | #299 | Tragic 94.1% |
| Immigrants | Burma/Myanmar | 0.0 /100 | #300 | Tragic 94.1% |
| Immigrants | Laos | 0.0 /100 | #301 | Tragic 94.1% |