Sioux vs Immigrants from Nepal 8th Grade
COMPARE
Sioux
Immigrants from Nepal
8th Grade
8th Grade Comparison
Sioux
Immigrants from Nepal
97.1%
8TH GRADE
100.0/ 100
METRIC RATING
30th/ 347
METRIC RANK
95.6%
8TH GRADE
30.2/ 100
METRIC RATING
191st/ 347
METRIC RANK
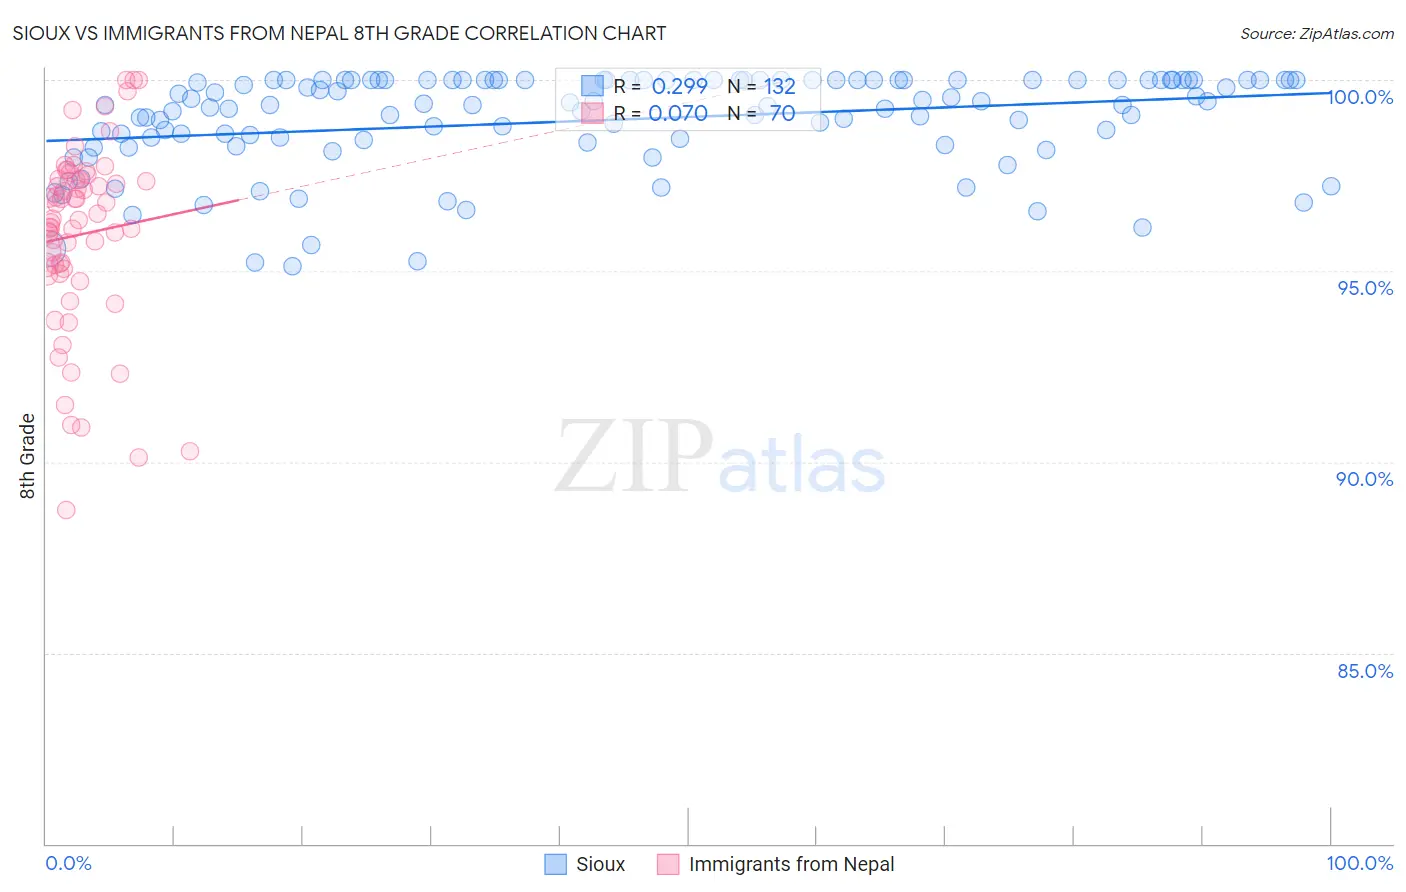
Sioux vs Immigrants from Nepal 8th Grade Correlation Chart
The statistical analysis conducted on geographies consisting of 234,197,525 people shows a weak positive correlation between the proportion of Sioux and percentage of population with at least 8th grade education in the United States with a correlation coefficient (R) of 0.299 and weighted average of 97.1%. Similarly, the statistical analysis conducted on geographies consisting of 186,622,433 people shows a slight positive correlation between the proportion of Immigrants from Nepal and percentage of population with at least 8th grade education in the United States with a correlation coefficient (R) of 0.070 and weighted average of 95.6%, a difference of 1.5%.
8th Grade Correlation Summary
| Measurement | Sioux | Immigrants from Nepal |
| Minimum | 95.1% | 88.7% |
| Maximum | 100.0% | 100.0% |
| Range | 4.9% | 11.3% |
| Mean | 98.9% | 96.0% |
| Median | 99.4% | 96.4% |
| Interquartile 25% (IQ1) | 98.4% | 95.1% |
| Interquartile 75% (IQ3) | 100.0% | 97.4% |
| Interquartile Range (IQR) | 1.6% | 2.3% |
| Standard Deviation (Sample) | 1.3% | 2.4% |
| Standard Deviation (Population) | 1.3% | 2.4% |
Similar Demographics by 8th Grade
Demographics Similar to Sioux by 8th Grade
In terms of 8th grade, the demographic groups most similar to Sioux are Chippewa (97.1%, a difference of 0.0%), Italian (97.1%, a difference of 0.030%), European (97.1%, a difference of 0.030%), Yup'ik (97.0%, a difference of 0.030%), and Scotch-Irish (97.1%, a difference of 0.040%).
| Demographics | Rating | Rank | 8th Grade |
| French Canadians | 100.0 /100 | #23 | Exceptional 97.2% |
| Scandinavians | 100.0 /100 | #24 | Exceptional 97.2% |
| Czechs | 100.0 /100 | #25 | Exceptional 97.1% |
| French | 100.0 /100 | #26 | Exceptional 97.1% |
| Scotch-Irish | 100.0 /100 | #27 | Exceptional 97.1% |
| Italians | 100.0 /100 | #28 | Exceptional 97.1% |
| Europeans | 100.0 /100 | #29 | Exceptional 97.1% |
| Sioux | 100.0 /100 | #30 | Exceptional 97.1% |
| Chippewa | 100.0 /100 | #31 | Exceptional 97.1% |
| Yup'ik | 100.0 /100 | #32 | Exceptional 97.0% |
| Swiss | 100.0 /100 | #33 | Exceptional 97.0% |
| Luxembourgers | 100.0 /100 | #34 | Exceptional 97.0% |
| Alaska Natives | 100.0 /100 | #35 | Exceptional 97.0% |
| Belgians | 100.0 /100 | #36 | Exceptional 97.0% |
| Latvians | 100.0 /100 | #37 | Exceptional 97.0% |
Demographics Similar to Immigrants from Nepal by 8th Grade
In terms of 8th grade, the demographic groups most similar to Immigrants from Nepal are Immigrants from Venezuela (95.6%, a difference of 0.0%), Immigrants from Micronesia (95.6%, a difference of 0.010%), Pima (95.6%, a difference of 0.010%), Panamanian (95.6%, a difference of 0.010%), and Sudanese (95.6%, a difference of 0.020%).
| Demographics | Rating | Rank | 8th Grade |
| Immigrants | Uganda | 36.0 /100 | #184 | Fair 95.6% |
| Blacks/African Americans | 34.8 /100 | #185 | Fair 95.6% |
| Brazilians | 34.8 /100 | #186 | Fair 95.6% |
| Sudanese | 33.0 /100 | #187 | Fair 95.6% |
| Liberians | 32.4 /100 | #188 | Fair 95.6% |
| Immigrants | Micronesia | 31.6 /100 | #189 | Fair 95.6% |
| Immigrants | Venezuela | 30.8 /100 | #190 | Fair 95.6% |
| Immigrants | Nepal | 30.2 /100 | #191 | Fair 95.6% |
| Pima | 28.6 /100 | #192 | Fair 95.6% |
| Panamanians | 28.4 /100 | #193 | Fair 95.6% |
| Guamanians/Chamorros | 26.6 /100 | #194 | Fair 95.6% |
| Immigrants | Zaire | 25.2 /100 | #195 | Fair 95.6% |
| Assyrians/Chaldeans/Syriacs | 24.5 /100 | #196 | Fair 95.6% |
| Sierra Leoneans | 24.3 /100 | #197 | Fair 95.6% |
| Paraguayans | 22.6 /100 | #198 | Fair 95.5% |