Sioux vs Immigrants from Ireland 8th Grade
COMPARE
Sioux
Immigrants from Ireland
8th Grade
8th Grade Comparison
Sioux
Immigrants from Ireland
97.1%
8TH GRADE
100.0/ 100
METRIC RATING
30th/ 347
METRIC RANK
96.5%
8TH GRADE
99.5/ 100
METRIC RATING
74th/ 347
METRIC RANK
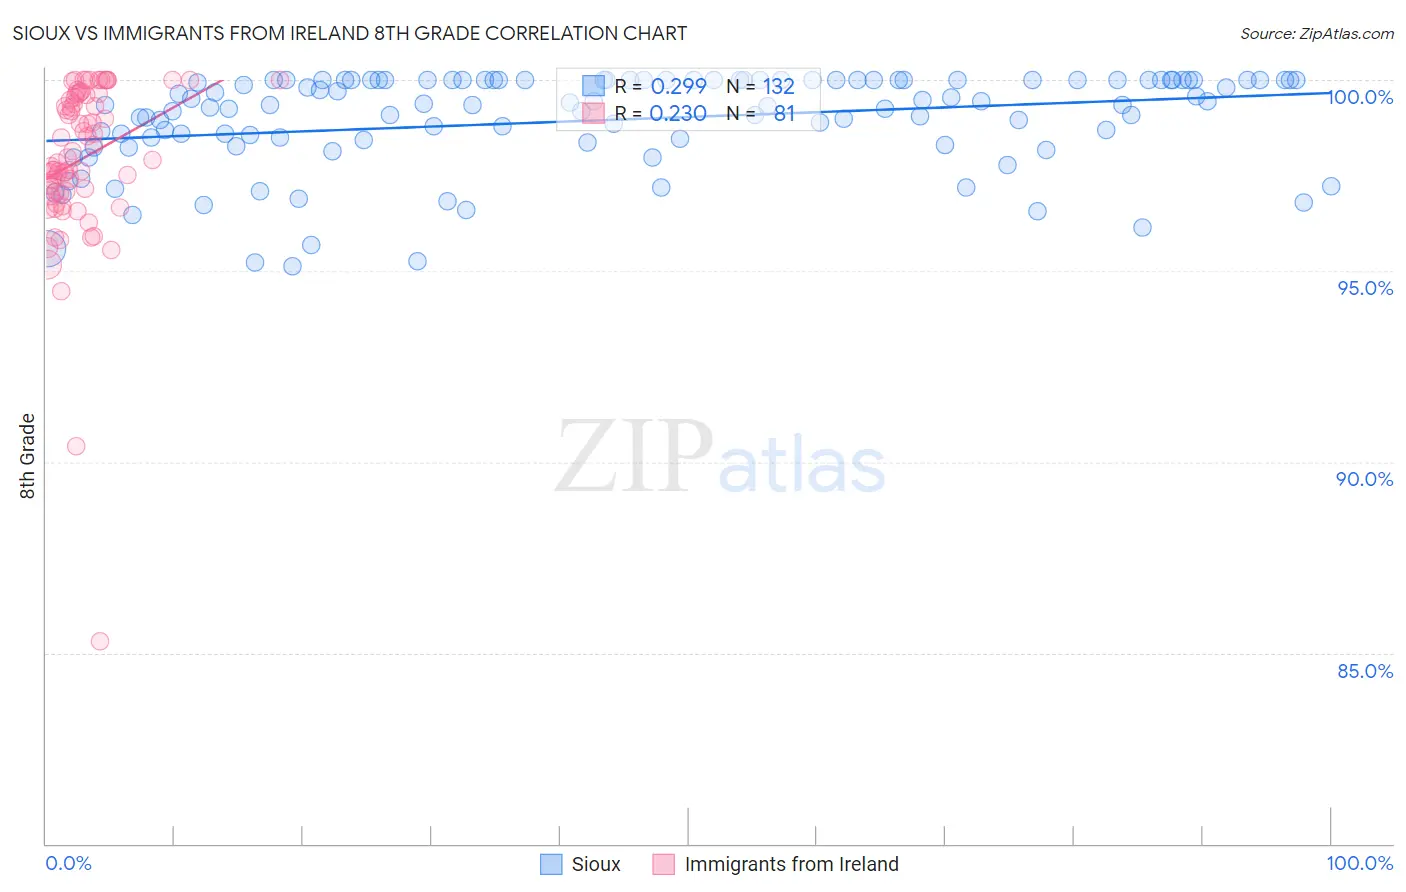
Sioux vs Immigrants from Ireland 8th Grade Correlation Chart
The statistical analysis conducted on geographies consisting of 234,197,525 people shows a weak positive correlation between the proportion of Sioux and percentage of population with at least 8th grade education in the United States with a correlation coefficient (R) of 0.299 and weighted average of 97.1%. Similarly, the statistical analysis conducted on geographies consisting of 240,784,498 people shows a weak positive correlation between the proportion of Immigrants from Ireland and percentage of population with at least 8th grade education in the United States with a correlation coefficient (R) of 0.230 and weighted average of 96.5%, a difference of 0.56%.
8th Grade Correlation Summary
| Measurement | Sioux | Immigrants from Ireland |
| Minimum | 95.1% | 85.3% |
| Maximum | 100.0% | 100.0% |
| Range | 4.9% | 14.7% |
| Mean | 98.9% | 97.9% |
| Median | 99.4% | 98.0% |
| Interquartile 25% (IQ1) | 98.4% | 97.1% |
| Interquartile 75% (IQ3) | 100.0% | 99.6% |
| Interquartile Range (IQR) | 1.6% | 2.6% |
| Standard Deviation (Sample) | 1.3% | 2.2% |
| Standard Deviation (Population) | 1.3% | 2.2% |
Similar Demographics by 8th Grade
Demographics Similar to Sioux by 8th Grade
In terms of 8th grade, the demographic groups most similar to Sioux are Chippewa (97.1%, a difference of 0.0%), Italian (97.1%, a difference of 0.030%), European (97.1%, a difference of 0.030%), Yup'ik (97.0%, a difference of 0.030%), and Scotch-Irish (97.1%, a difference of 0.040%).
| Demographics | Rating | Rank | 8th Grade |
| French Canadians | 100.0 /100 | #23 | Exceptional 97.2% |
| Scandinavians | 100.0 /100 | #24 | Exceptional 97.2% |
| Czechs | 100.0 /100 | #25 | Exceptional 97.1% |
| French | 100.0 /100 | #26 | Exceptional 97.1% |
| Scotch-Irish | 100.0 /100 | #27 | Exceptional 97.1% |
| Italians | 100.0 /100 | #28 | Exceptional 97.1% |
| Europeans | 100.0 /100 | #29 | Exceptional 97.1% |
| Sioux | 100.0 /100 | #30 | Exceptional 97.1% |
| Chippewa | 100.0 /100 | #31 | Exceptional 97.1% |
| Yup'ik | 100.0 /100 | #32 | Exceptional 97.0% |
| Swiss | 100.0 /100 | #33 | Exceptional 97.0% |
| Luxembourgers | 100.0 /100 | #34 | Exceptional 97.0% |
| Alaska Natives | 100.0 /100 | #35 | Exceptional 97.0% |
| Belgians | 100.0 /100 | #36 | Exceptional 97.0% |
| Latvians | 100.0 /100 | #37 | Exceptional 97.0% |
Demographics Similar to Immigrants from Ireland by 8th Grade
In terms of 8th grade, the demographic groups most similar to Immigrants from Ireland are New Zealander (96.6%, a difference of 0.010%), Immigrants from England (96.6%, a difference of 0.010%), Arapaho (96.6%, a difference of 0.010%), Zimbabwean (96.5%, a difference of 0.010%), and Immigrants from Netherlands (96.5%, a difference of 0.010%).
| Demographics | Rating | Rank | 8th Grade |
| Iranians | 99.7 /100 | #67 | Exceptional 96.6% |
| Creek | 99.7 /100 | #68 | Exceptional 96.6% |
| Americans | 99.7 /100 | #69 | Exceptional 96.6% |
| Immigrants | Lithuania | 99.6 /100 | #70 | Exceptional 96.6% |
| New Zealanders | 99.5 /100 | #71 | Exceptional 96.6% |
| Immigrants | England | 99.5 /100 | #72 | Exceptional 96.6% |
| Arapaho | 99.5 /100 | #73 | Exceptional 96.6% |
| Immigrants | Ireland | 99.5 /100 | #74 | Exceptional 96.5% |
| Zimbabweans | 99.4 /100 | #75 | Exceptional 96.5% |
| Immigrants | Netherlands | 99.4 /100 | #76 | Exceptional 96.5% |
| Cypriots | 99.4 /100 | #77 | Exceptional 96.5% |
| Yugoslavians | 99.4 /100 | #78 | Exceptional 96.5% |
| Puget Sound Salish | 99.3 /100 | #79 | Exceptional 96.5% |
| Delaware | 99.2 /100 | #80 | Exceptional 96.5% |
| Romanians | 99.2 /100 | #81 | Exceptional 96.5% |