Colville vs Immigrants from Nepal 8th Grade
COMPARE
Colville
Immigrants from Nepal
8th Grade
8th Grade Comparison
Colville
Immigrants from Nepal
96.0%
8TH GRADE
84.0/ 100
METRIC RATING
147th/ 347
METRIC RANK
95.6%
8TH GRADE
30.2/ 100
METRIC RATING
191st/ 347
METRIC RANK
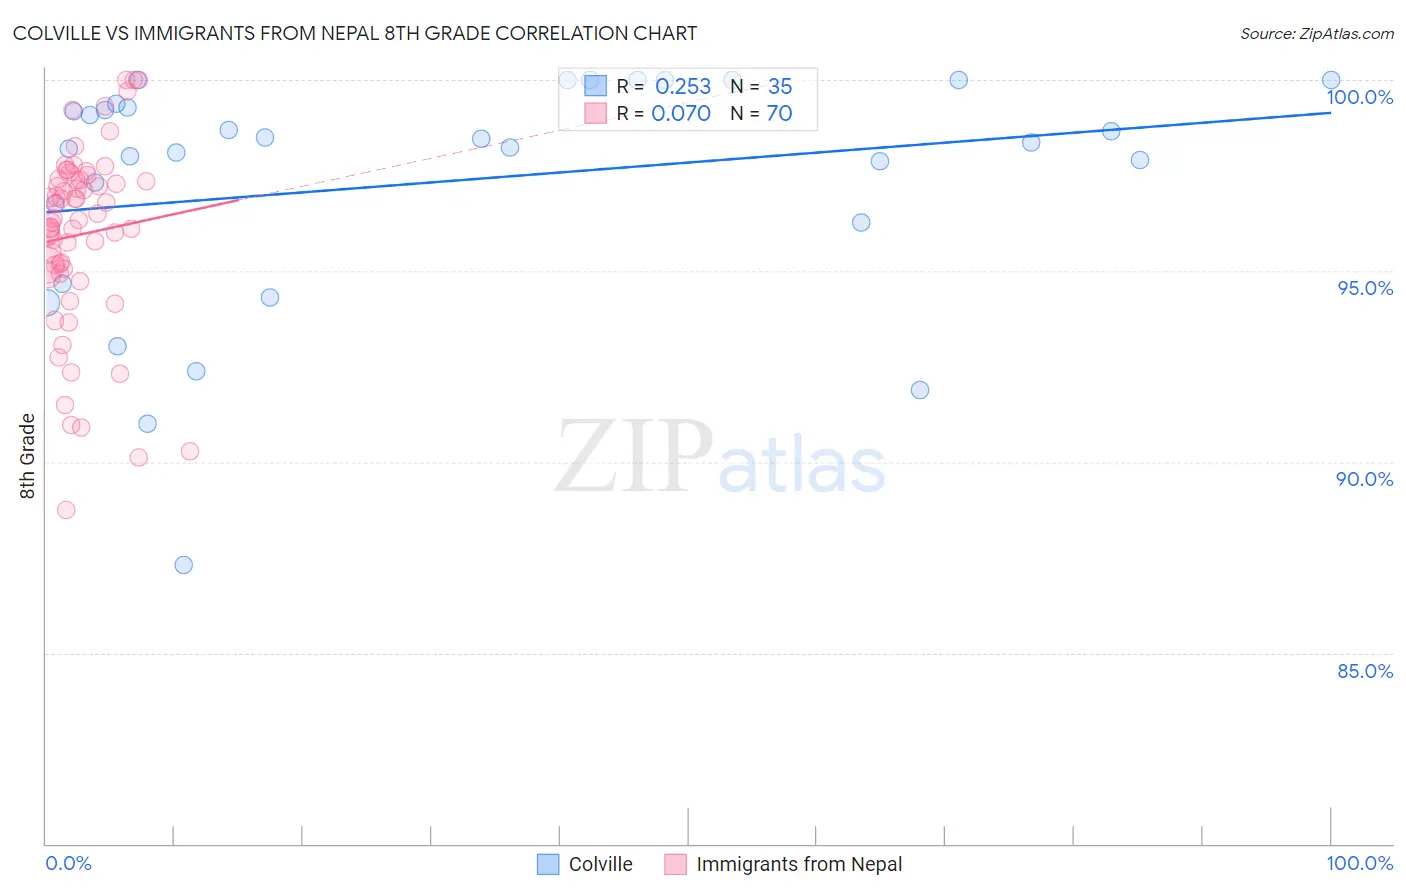
Colville vs Immigrants from Nepal 8th Grade Correlation Chart
The statistical analysis conducted on geographies consisting of 34,682,094 people shows a weak positive correlation between the proportion of Colville and percentage of population with at least 8th grade education in the United States with a correlation coefficient (R) of 0.253 and weighted average of 96.0%. Similarly, the statistical analysis conducted on geographies consisting of 186,622,433 people shows a slight positive correlation between the proportion of Immigrants from Nepal and percentage of population with at least 8th grade education in the United States with a correlation coefficient (R) of 0.070 and weighted average of 95.6%, a difference of 0.41%.
8th Grade Correlation Summary
| Measurement | Colville | Immigrants from Nepal |
| Minimum | 87.3% | 88.7% |
| Maximum | 100.0% | 100.0% |
| Range | 12.7% | 11.3% |
| Mean | 97.3% | 96.0% |
| Median | 98.4% | 96.4% |
| Interquartile 25% (IQ1) | 96.3% | 95.1% |
| Interquartile 75% (IQ3) | 99.4% | 97.4% |
| Interquartile Range (IQR) | 3.1% | 2.3% |
| Standard Deviation (Sample) | 3.1% | 2.4% |
| Standard Deviation (Population) | 3.1% | 2.4% |
Similar Demographics by 8th Grade
Demographics Similar to Colville by 8th Grade
In terms of 8th grade, the demographic groups most similar to Colville are Lumbee (96.0%, a difference of 0.0%), Israeli (96.0%, a difference of 0.0%), Spanish (96.0%, a difference of 0.010%), Immigrants from Belarus (96.0%, a difference of 0.010%), and Albanian (96.0%, a difference of 0.010%).
| Demographics | Rating | Rank | 8th Grade |
| Immigrants | South Central Asia | 89.4 /100 | #140 | Excellent 96.1% |
| Immigrants | Greece | 85.9 /100 | #141 | Excellent 96.0% |
| Immigrants | Eastern Europe | 85.4 /100 | #142 | Excellent 96.0% |
| Spanish | 85.1 /100 | #143 | Excellent 96.0% |
| Immigrants | Belarus | 84.8 /100 | #144 | Excellent 96.0% |
| Lumbee | 84.1 /100 | #145 | Excellent 96.0% |
| Israelis | 84.1 /100 | #146 | Excellent 96.0% |
| Colville | 84.0 /100 | #147 | Excellent 96.0% |
| Albanians | 83.1 /100 | #148 | Excellent 96.0% |
| Immigrants | Israel | 81.3 /100 | #149 | Excellent 96.0% |
| Immigrants | Russia | 80.9 /100 | #150 | Excellent 96.0% |
| Blackfeet | 80.8 /100 | #151 | Excellent 96.0% |
| French American Indians | 80.6 /100 | #152 | Excellent 96.0% |
| Immigrants | Jordan | 79.5 /100 | #153 | Good 95.9% |
| Hopi | 79.4 /100 | #154 | Good 95.9% |
Demographics Similar to Immigrants from Nepal by 8th Grade
In terms of 8th grade, the demographic groups most similar to Immigrants from Nepal are Immigrants from Venezuela (95.6%, a difference of 0.0%), Immigrants from Micronesia (95.6%, a difference of 0.010%), Pima (95.6%, a difference of 0.010%), Panamanian (95.6%, a difference of 0.010%), and Sudanese (95.6%, a difference of 0.020%).
| Demographics | Rating | Rank | 8th Grade |
| Immigrants | Uganda | 36.0 /100 | #184 | Fair 95.6% |
| Blacks/African Americans | 34.8 /100 | #185 | Fair 95.6% |
| Brazilians | 34.8 /100 | #186 | Fair 95.6% |
| Sudanese | 33.0 /100 | #187 | Fair 95.6% |
| Liberians | 32.4 /100 | #188 | Fair 95.6% |
| Immigrants | Micronesia | 31.6 /100 | #189 | Fair 95.6% |
| Immigrants | Venezuela | 30.8 /100 | #190 | Fair 95.6% |
| Immigrants | Nepal | 30.2 /100 | #191 | Fair 95.6% |
| Pima | 28.6 /100 | #192 | Fair 95.6% |
| Panamanians | 28.4 /100 | #193 | Fair 95.6% |
| Guamanians/Chamorros | 26.6 /100 | #194 | Fair 95.6% |
| Immigrants | Zaire | 25.2 /100 | #195 | Fair 95.6% |
| Assyrians/Chaldeans/Syriacs | 24.5 /100 | #196 | Fair 95.6% |
| Sierra Leoneans | 24.3 /100 | #197 | Fair 95.6% |
| Paraguayans | 22.6 /100 | #198 | Fair 95.5% |