Sierra Leonean vs South American Indian Professional Degree
COMPARE
Sierra Leonean
South American Indian
Professional Degree
Professional Degree Comparison
Sierra Leoneans
South American Indians
4.5%
PROFESSIONAL DEGREE
64.3/ 100
METRIC RATING
163rd/ 347
METRIC RANK
4.8%
PROFESSIONAL DEGREE
89.9/ 100
METRIC RATING
134th/ 347
METRIC RANK
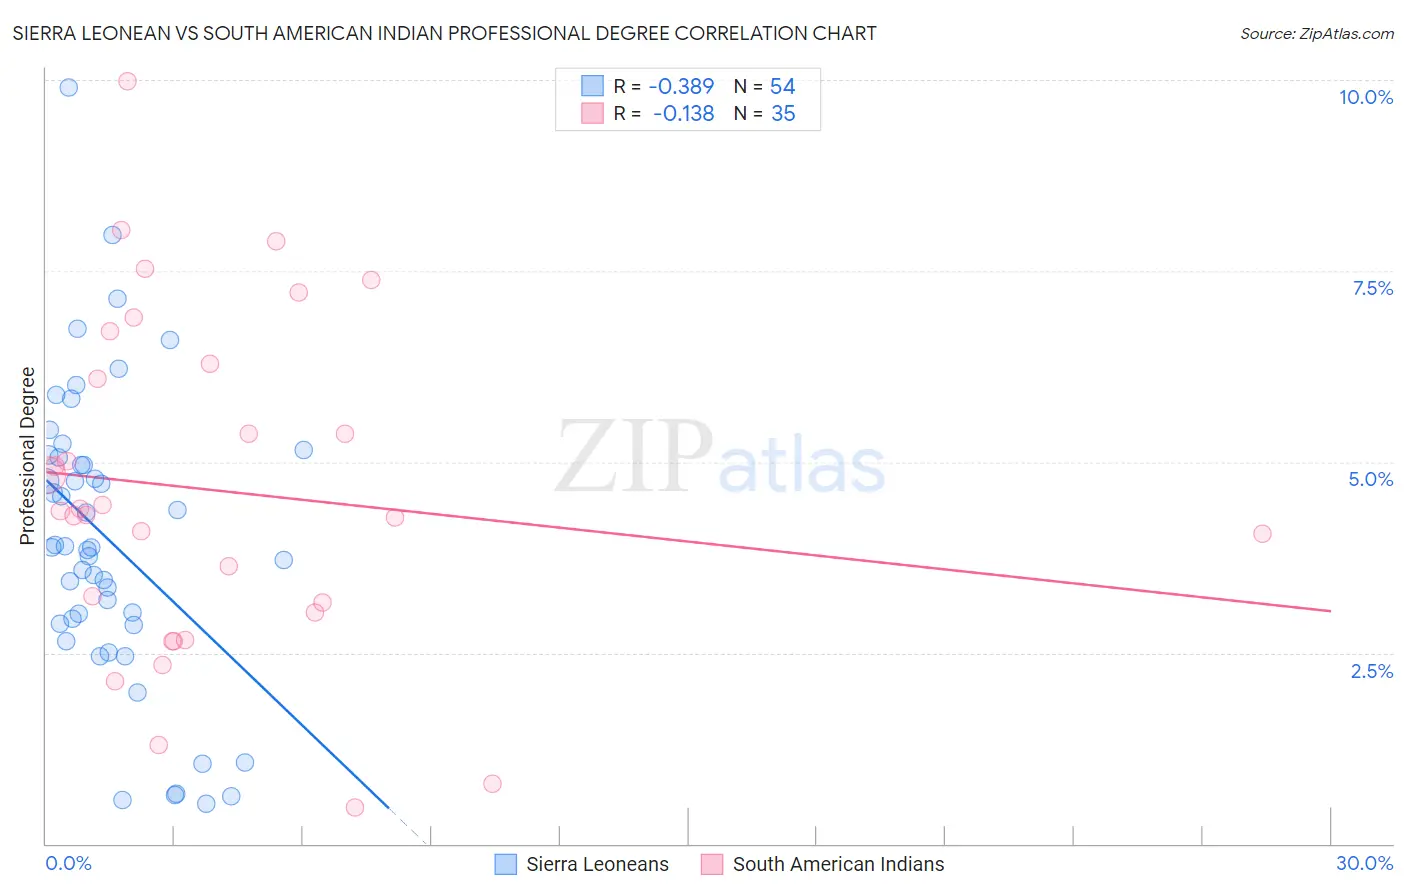
Sierra Leonean vs South American Indian Professional Degree Correlation Chart
The statistical analysis conducted on geographies consisting of 83,321,250 people shows a mild negative correlation between the proportion of Sierra Leoneans and percentage of population with at least professional degree education in the United States with a correlation coefficient (R) of -0.389 and weighted average of 4.5%. Similarly, the statistical analysis conducted on geographies consisting of 164,487,198 people shows a poor negative correlation between the proportion of South American Indians and percentage of population with at least professional degree education in the United States with a correlation coefficient (R) of -0.138 and weighted average of 4.8%, a difference of 5.7%.
Professional Degree Correlation Summary
| Measurement | Sierra Leonean | South American Indian |
| Minimum | 0.52% | 0.48% |
| Maximum | 9.9% | 10.0% |
| Range | 9.4% | 9.5% |
| Mean | 4.0% | 4.6% |
| Median | 3.9% | 4.4% |
| Interquartile 25% (IQ1) | 2.9% | 3.0% |
| Interquartile 75% (IQ3) | 5.1% | 6.3% |
| Interquartile Range (IQR) | 2.2% | 3.3% |
| Standard Deviation (Sample) | 1.9% | 2.2% |
| Standard Deviation (Population) | 1.9% | 2.2% |
Similar Demographics by Professional Degree
Demographics Similar to Sierra Leoneans by Professional Degree
In terms of professional degree, the demographic groups most similar to Sierra Leoneans are Peruvian (4.5%, a difference of 0.14%), Assyrian/Chaldean/Syriac (4.5%, a difference of 0.48%), Swiss (4.5%, a difference of 0.50%), Immigrants from Senegal (4.5%, a difference of 0.59%), and Vietnamese (4.5%, a difference of 0.64%).
| Demographics | Rating | Rank | Professional Degree |
| Swedes | 69.9 /100 | #156 | Good 4.5% |
| Iraqis | 69.8 /100 | #157 | Good 4.5% |
| Immigrants | Armenia | 68.8 /100 | #158 | Good 4.5% |
| Vietnamese | 68.4 /100 | #159 | Good 4.5% |
| Immigrants | Senegal | 68.0 /100 | #160 | Good 4.5% |
| Assyrians/Chaldeans/Syriacs | 67.4 /100 | #161 | Good 4.5% |
| Peruvians | 65.2 /100 | #162 | Good 4.5% |
| Sierra Leoneans | 64.3 /100 | #163 | Good 4.5% |
| Swiss | 61.0 /100 | #164 | Good 4.5% |
| Costa Ricans | 59.9 /100 | #165 | Average 4.5% |
| Immigrants | Colombia | 59.4 /100 | #166 | Average 4.5% |
| Immigrants | Afghanistan | 59.2 /100 | #167 | Average 4.5% |
| Immigrants | Sierra Leone | 58.7 /100 | #168 | Average 4.5% |
| Chinese | 58.6 /100 | #169 | Average 4.5% |
| Immigrants | Zaire | 57.4 /100 | #170 | Average 4.5% |
Demographics Similar to South American Indians by Professional Degree
In terms of professional degree, the demographic groups most similar to South American Indians are Macedonian (4.8%, a difference of 0.040%), Italian (4.8%, a difference of 0.12%), Immigrants from Jordan (4.7%, a difference of 0.31%), Jordanian (4.7%, a difference of 0.34%), and Pakistani (4.8%, a difference of 0.38%).
| Demographics | Rating | Rank | Professional Degree |
| Serbians | 92.6 /100 | #127 | Exceptional 4.8% |
| Immigrants | Eastern Africa | 92.5 /100 | #128 | Exceptional 4.8% |
| Palestinians | 91.5 /100 | #129 | Exceptional 4.8% |
| Icelanders | 91.5 /100 | #130 | Exceptional 4.8% |
| Immigrants | Nepal | 91.4 /100 | #131 | Exceptional 4.8% |
| Pakistanis | 90.9 /100 | #132 | Exceptional 4.8% |
| Italians | 90.2 /100 | #133 | Exceptional 4.8% |
| South American Indians | 89.9 /100 | #134 | Excellent 4.8% |
| Macedonians | 89.8 /100 | #135 | Excellent 4.8% |
| Immigrants | Jordan | 89.0 /100 | #136 | Excellent 4.7% |
| Jordanians | 88.9 /100 | #137 | Excellent 4.7% |
| Afghans | 88.8 /100 | #138 | Excellent 4.7% |
| South Americans | 85.6 /100 | #139 | Excellent 4.7% |
| Canadians | 84.4 /100 | #140 | Excellent 4.7% |
| Basques | 81.8 /100 | #141 | Excellent 4.6% |