Sierra Leonean vs Dutch West Indian High School Diploma
COMPARE
Sierra Leonean
Dutch West Indian
High School Diploma
High School Diploma Comparison
Sierra Leoneans
Dutch West Indians
89.1%
HIGH SCHOOL DIPLOMA
48.4/ 100
METRIC RATING
178th/ 347
METRIC RANK
86.5%
HIGH SCHOOL DIPLOMA
0.0/ 100
METRIC RATING
282nd/ 347
METRIC RANK
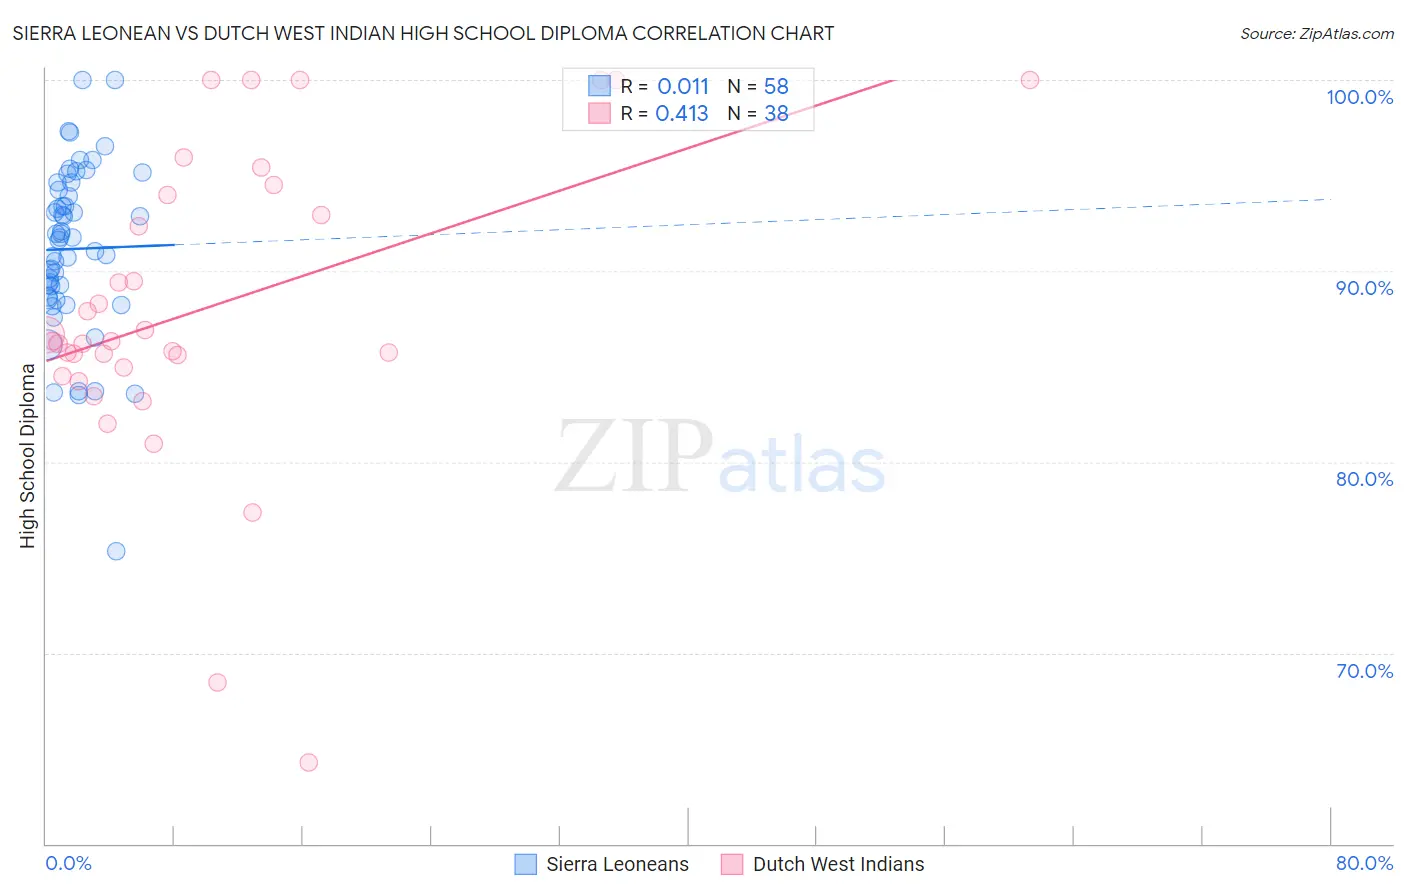
Sierra Leonean vs Dutch West Indian High School Diploma Correlation Chart
The statistical analysis conducted on geographies consisting of 83,355,497 people shows no correlation between the proportion of Sierra Leoneans and percentage of population with at least high school diploma education in the United States with a correlation coefficient (R) of 0.011 and weighted average of 89.1%. Similarly, the statistical analysis conducted on geographies consisting of 85,776,098 people shows a moderate positive correlation between the proportion of Dutch West Indians and percentage of population with at least high school diploma education in the United States with a correlation coefficient (R) of 0.413 and weighted average of 86.5%, a difference of 3.1%.
High School Diploma Correlation Summary
| Measurement | Sierra Leonean | Dutch West Indian |
| Minimum | 75.3% | 64.3% |
| Maximum | 100.0% | 100.0% |
| Range | 24.7% | 35.7% |
| Mean | 91.2% | 88.1% |
| Median | 91.7% | 86.3% |
| Interquartile 25% (IQ1) | 88.7% | 84.9% |
| Interquartile 75% (IQ3) | 94.2% | 94.0% |
| Interquartile Range (IQR) | 5.6% | 9.1% |
| Standard Deviation (Sample) | 4.4% | 8.0% |
| Standard Deviation (Population) | 4.4% | 7.9% |
Similar Demographics by High School Diploma
Demographics Similar to Sierra Leoneans by High School Diploma
In terms of high school diploma, the demographic groups most similar to Sierra Leoneans are Sudanese (89.1%, a difference of 0.0%), Immigrants from Western Asia (89.1%, a difference of 0.010%), Osage (89.1%, a difference of 0.010%), Hmong (89.1%, a difference of 0.020%), and American (89.1%, a difference of 0.020%).
| Demographics | Rating | Rank | High School Diploma |
| Spanish | 52.9 /100 | #171 | Average 89.2% |
| Immigrants | Nonimmigrants | 51.8 /100 | #172 | Average 89.2% |
| Immigrants | Indonesia | 50.3 /100 | #173 | Average 89.1% |
| Hmong | 50.0 /100 | #174 | Average 89.1% |
| Immigrants | Western Asia | 49.0 /100 | #175 | Average 89.1% |
| Osage | 48.9 /100 | #176 | Average 89.1% |
| Sudanese | 48.5 /100 | #177 | Average 89.1% |
| Sierra Leoneans | 48.4 /100 | #178 | Average 89.1% |
| Americans | 47.2 /100 | #179 | Average 89.1% |
| Bolivians | 45.2 /100 | #180 | Average 89.1% |
| Venezuelans | 43.6 /100 | #181 | Average 89.1% |
| Spaniards | 43.4 /100 | #182 | Average 89.1% |
| Potawatomi | 42.5 /100 | #183 | Average 89.0% |
| Immigrants | Syria | 39.2 /100 | #184 | Fair 89.0% |
| Ethiopians | 37.0 /100 | #185 | Fair 89.0% |
Demographics Similar to Dutch West Indians by High School Diploma
In terms of high school diploma, the demographic groups most similar to Dutch West Indians are Indonesian (86.5%, a difference of 0.040%), Immigrants from Barbados (86.4%, a difference of 0.060%), Pueblo (86.5%, a difference of 0.090%), Paiute (86.4%, a difference of 0.10%), and Immigrants from Laos (86.6%, a difference of 0.11%).
| Demographics | Rating | Rank | High School Diploma |
| Immigrants | Trinidad and Tobago | 0.1 /100 | #275 | Tragic 86.8% |
| Immigrants | Burma/Myanmar | 0.1 /100 | #276 | Tragic 86.7% |
| Barbadians | 0.1 /100 | #277 | Tragic 86.7% |
| Hopi | 0.1 /100 | #278 | Tragic 86.6% |
| Immigrants | Laos | 0.0 /100 | #279 | Tragic 86.6% |
| Pueblo | 0.0 /100 | #280 | Tragic 86.5% |
| Indonesians | 0.0 /100 | #281 | Tragic 86.5% |
| Dutch West Indians | 0.0 /100 | #282 | Tragic 86.5% |
| Immigrants | Barbados | 0.0 /100 | #283 | Tragic 86.4% |
| Paiute | 0.0 /100 | #284 | Tragic 86.4% |
| Immigrants | West Indies | 0.0 /100 | #285 | Tragic 86.2% |
| Immigrants | St. Vincent and the Grenadines | 0.0 /100 | #286 | Tragic 86.2% |
| Ute | 0.0 /100 | #287 | Tragic 86.2% |
| Immigrants | Vietnam | 0.0 /100 | #288 | Tragic 86.2% |
| Yup'ik | 0.0 /100 | #289 | Tragic 86.1% |