Sierra Leonean vs Immigrants from Taiwan 3rd Grade
COMPARE
Sierra Leonean
Immigrants from Taiwan
3rd Grade
3rd Grade Comparison
Sierra Leoneans
Immigrants from Taiwan
97.5%
3RD GRADE
4.6/ 100
METRIC RATING
222nd/ 347
METRIC RANK
97.7%
3RD GRADE
34.2/ 100
METRIC RATING
188th/ 347
METRIC RANK
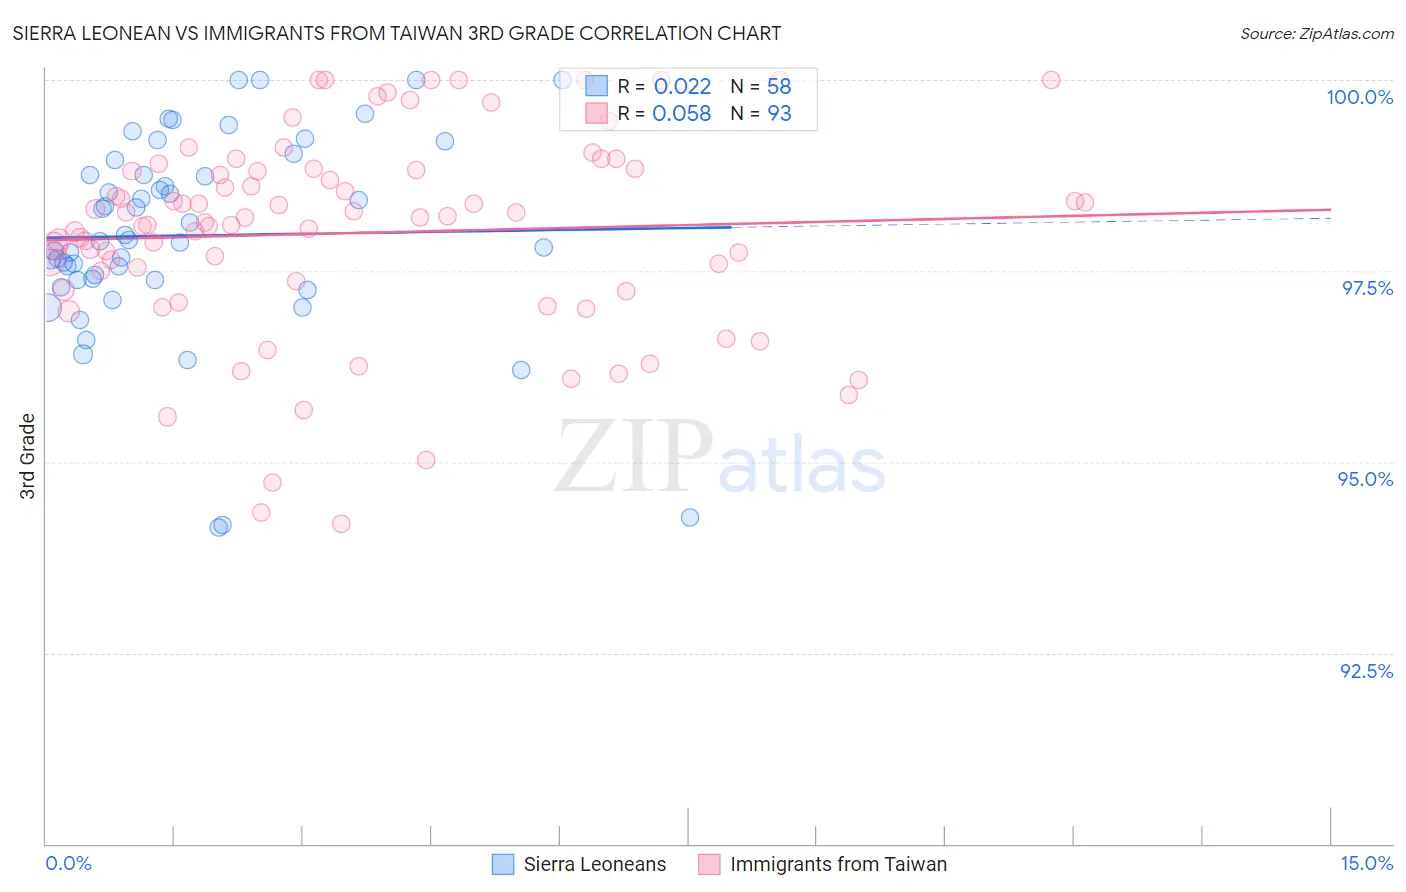
Sierra Leonean vs Immigrants from Taiwan 3rd Grade Correlation Chart
The statistical analysis conducted on geographies consisting of 83,337,655 people shows no correlation between the proportion of Sierra Leoneans and percentage of population with at least 3rd grade education in the United States with a correlation coefficient (R) of 0.022 and weighted average of 97.5%. Similarly, the statistical analysis conducted on geographies consisting of 298,069,082 people shows a slight positive correlation between the proportion of Immigrants from Taiwan and percentage of population with at least 3rd grade education in the United States with a correlation coefficient (R) of 0.058 and weighted average of 97.7%, a difference of 0.20%.
3rd Grade Correlation Summary
| Measurement | Sierra Leonean | Immigrants from Taiwan |
| Minimum | 94.1% | 94.2% |
| Maximum | 100.0% | 100.0% |
| Range | 5.9% | 5.8% |
| Mean | 98.0% | 98.0% |
| Median | 97.9% | 98.2% |
| Interquartile 25% (IQ1) | 97.4% | 97.3% |
| Interquartile 75% (IQ3) | 98.8% | 98.8% |
| Interquartile Range (IQR) | 1.4% | 1.5% |
| Standard Deviation (Sample) | 1.3% | 1.3% |
| Standard Deviation (Population) | 1.3% | 1.3% |
Similar Demographics by 3rd Grade
Demographics Similar to Sierra Leoneans by 3rd Grade
In terms of 3rd grade, the demographic groups most similar to Sierra Leoneans are Immigrants from Syria (97.5%, a difference of 0.0%), Bahamian (97.5%, a difference of 0.0%), Tongan (97.5%, a difference of 0.0%), Immigrants from Nepal (97.5%, a difference of 0.010%), and Immigrants from Panama (97.5%, a difference of 0.010%).
| Demographics | Rating | Rank | 3rd Grade |
| Iraqis | 6.9 /100 | #215 | Tragic 97.5% |
| Samoans | 6.9 /100 | #216 | Tragic 97.5% |
| South American Indians | 5.7 /100 | #217 | Tragic 97.5% |
| Immigrants | Nepal | 5.3 /100 | #218 | Tragic 97.5% |
| Immigrants | Panama | 5.2 /100 | #219 | Tragic 97.5% |
| Immigrants | Morocco | 5.0 /100 | #220 | Tragic 97.5% |
| Uruguayans | 5.0 /100 | #221 | Tragic 97.5% |
| Sierra Leoneans | 4.6 /100 | #222 | Tragic 97.5% |
| Immigrants | Syria | 4.4 /100 | #223 | Tragic 97.5% |
| Bahamians | 4.4 /100 | #224 | Tragic 97.5% |
| Tongans | 4.3 /100 | #225 | Tragic 97.5% |
| Sudanese | 4.1 /100 | #226 | Tragic 97.5% |
| Immigrants | Sudan | 3.4 /100 | #227 | Tragic 97.5% |
| Sub-Saharan Africans | 3.2 /100 | #228 | Tragic 97.5% |
| Senegalese | 3.0 /100 | #229 | Tragic 97.5% |
Demographics Similar to Immigrants from Taiwan by 3rd Grade
In terms of 3rd grade, the demographic groups most similar to Immigrants from Taiwan are Native/Alaskan (97.7%, a difference of 0.0%), Pakistani (97.7%, a difference of 0.0%), Immigrants from Kazakhstan (97.7%, a difference of 0.010%), Immigrants from Argentina (97.7%, a difference of 0.010%), and Portuguese (97.7%, a difference of 0.010%).
| Demographics | Rating | Rank | 3rd Grade |
| Immigrants | Venezuela | 44.4 /100 | #181 | Average 97.7% |
| Argentineans | 42.9 /100 | #182 | Average 97.7% |
| Arabs | 40.0 /100 | #183 | Fair 97.7% |
| Immigrants | Kazakhstan | 37.4 /100 | #184 | Fair 97.7% |
| Immigrants | Argentina | 37.0 /100 | #185 | Fair 97.7% |
| Portuguese | 36.2 /100 | #186 | Fair 97.7% |
| Natives/Alaskans | 35.2 /100 | #187 | Fair 97.7% |
| Immigrants | Taiwan | 34.2 /100 | #188 | Fair 97.7% |
| Pakistanis | 34.2 /100 | #189 | Fair 97.7% |
| Panamanians | 31.5 /100 | #190 | Fair 97.7% |
| Blacks/African Americans | 29.6 /100 | #191 | Fair 97.7% |
| Mongolians | 29.1 /100 | #192 | Fair 97.7% |
| Immigrants | Kenya | 28.2 /100 | #193 | Fair 97.7% |
| Immigrants | Uganda | 27.4 /100 | #194 | Fair 97.7% |
| Immigrants | Egypt | 26.8 /100 | #195 | Fair 97.7% |